Get Certified for
Capital Markets (CMSA®)
From equities and fixed income to derivatives, the CMSA certification bridges the gap from where you are now to where you want to be — a world-class capital markets analyst.
A technical analysis tool that indicates the expansion, or contraction, of the price range of a security over a period of time
The Average Directional Movement Index (ADX) was developed by famed technical analyst Welles Wilder as an indicator of trend strength. As a commodity trader, Wilder developed the indicator for trading commodity futures. However, it has since been widely applied by technical analysts to virtually every other tradeable investment, from stocks to forex to ETFs.
The average directional movement index is calculated to reflect the expansion, or contraction, of the price range of a security over a period of time. The traditional setting for the ADX indicator is 14 time periods, but analysts have commonly used the ADX with settings as low as 7 or as high as 30. Lower settings will make the average directional index respond more quickly to price movement but tend to generate more false signals. Higher settings will minimize false signals but make the average directional index a more lagging indicator.
Wilder calculated the average directional index by first calculating both a positive directional movement index (+DMI) and a negative directional movement index (-DMI) that compare current high and low prices to the previous time period’s high and low prices. The ADX itself is then calculated as the sum of the differences between +DMI and –DMI over a given time period.
All the necessary calculations are a bit complex. Fortunately, there’s no need to do them yourself. All you have to do is apply the average directional index indicator to a chart, with all the necessary calculations done for you, according to whatever time frame you choose. Again, the default number of time periods is 14.
The average directional index is, like momentum indicators such as the MACD or RSI, typically shown in a separate window above or below the main chart window that shows price. The ADX is shown as a line representing values that range from zero to 100.
It’s important to keep in mind that the average directional index is not a trend direction indicator, but an indicator of trend strength. A strong uptrend or a strong downtrend will both result in high average directional index values.
Some versions of the average directional index will also show the +DMI and –DMI lines. In Wilder’s original conception of the ADX, he envisioned using the +DMI and –DMI lines to determine trend direction and the average directional index line to determine trend strength, thus, in effect, making the average directional index a combination trend indicator and momentum indicator.
However, since then many technical analysts have preferred just seeing the ADX line itself, for two reasons: (1) the three lines intermingled can sometimes be visually confusing and (2) crossovers of the +DMI and –DMI lines have been found to frequently generate false signals. In short, the average directional index trading system that Wilder designed has generally been found to be more reliable as a trend strength indicator and less reliable as a trend direction indicator.
The average directional index indicator is used first of all to determine whether a market is trending at all, as opposed to merely trading back and forth within a range, and secondly to determine the strength of a trend in a trending market. Finally, the average directional index is also often used, as other momentum indicators are, to indicate a potential market reversal or trend change.
When the value of the average directional index line is below 25, a market is considered to be ranging rather than trending. Some analysts peg only average directional index readings below 20 as indicative of the absence of a trend, and readings between 20 and 25 as possible, but not conclusively, indicating the presence of a trend.
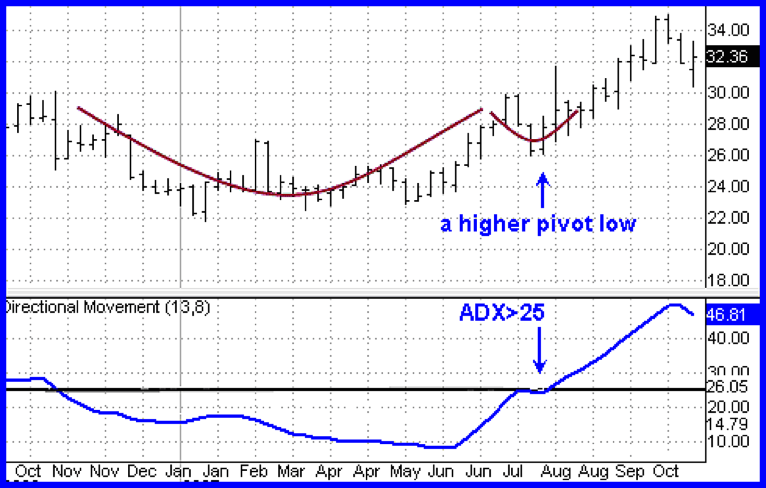
Any average directional index reading above 25 is interpreted as indicating the existence of a genuine trend. Readings between 25 and 50 indicate a beginning or moderate strength trend. Readings between 50 and 100 represent increasingly strong trends. The chart shown below shows the average directional index indicating an increasingly strong uptrend as average directional index readings rise from below 10 to nearly 50.

The direction of trend strength – increasingly or decreasingly strong – can easily be determined simply by looking at the slope of the ADX line. An upsloping ADX line shows a strengthening trend, while a downsloping ADX line indicates a weakening trend. A steeper angle of slope indicates a stronger trend, while a shallower angle indicates a trend with less strength.
NOTE: A change in the direction of the ADX slope can serve as an early indicator of a developing trend even before ADX readings go above 25. Referring to the chart shown above, you can see that the ADX slope turned upward well before the ADX reading rose to 25 and indicated the existence of a trend. But before you go buying a security every time the ADX slope turns from downward to upward, keep in mind that the ADX line might just as easily have turned back to the downside before a genuine uptrend became established – in other words, you might get caught jumping the gun a bit.
Analysts and investors rarely use the average directional index indicator alone. Since it does not indicate trend direction, it is commonly used in conjunction with trend indicators, such as moving averages or support and resistance areas, which are used to analyze price movement.
For example, an ideal application of using trend indicators in combination with the ADX would be an instance where the price of a security has traded within a range, with clearly defined support and resistance price levels, but then breaks out of that trading range by trading through a support or resistance level. If the price breakout is accompanied by rising ADX readings that indicate the presence of a trend, then that would constitute a confirming indication of the validity of the breakout, and an analyst would project a trend continuing in the direction of the breakout.
The ADX is also sometimes used, as other momentum indicators are, as a divergence indicator that can signal an impending trend change or market reversal.
ADX values will rise to increasingly high levels along with price in a market that is trending strongly higher. But if ADX levels begin to decline even as price rises higher, this divergence between price movement and the ADX may signal that the market is losing momentum and therefore may be due for a turn to the downside. In such a situation, analysts will carefully monitor price movement for further indications of a possible trend change, the ADX decline having served as a sort of early warning signal.
The average directional index has been found by technical analysts to be a very helpful indicator and has become one of the most frequently used technical analysis tools around. It is one of the most reliable trend strength indicators and has helped many analysts to correctly identify ranging markets and thus avoid being lured into buying false breakouts or buying into markets that are basically just flat and going nowhere.
You may well wish to consider adding the average directional index to your technical analysis arsenal.


