McClellan Oscillator – Technical Analysis
A momentum indicator that shows the strength or weakness of price movement, rather than its direction
The McClellan Oscillator
Every trader and analyst relies on, or studies, different technical indicators to help them play the market to their advantage. Indicators are often grouped into different categories according to how they measure different things. In the case of the McClellan Oscillator, it belongs to a group known as momentum indicators, which are designed to indicate the strength or weakness of price movement, rather than its direction.
Momentum Oscillators
There are two broad categories often applied to indicators: leading and lagging. Momentum oscillators are typically considered leading indicators, which are structured to lead price shifts. In other words, momentum indicators, when functioning efficiently, will provide an indication of a shift or change in price direction or trend before the change actually occurs.
Some of the most popular leading indicators are momentum oscillators which, in the most simple terms, measure how quickly a security’s price changes. When the price of a security climbs more rapidly, price momentum also increases. The more quickly the security climbs, or the larger the change in price period-over-period, the more significantly the momentum increases. As can logically be deduced then, as the climb slows down, so too will the momentum.
Something for traders to keep in mind, however, is that momentum will also decline when a security trades sideways, especially when momentum has previously been at particularly high levels. Therefore, a decrease in momentum is not always a signal of an impending market reversal. It may simply be an indication that momentum has returned to a median state.
What Is the McClellan Oscillator?
The McClellan Oscillator was developed by Sherman and Marian McClellan, in 1969, as a market breadth indicator most often used for short-term and intermediate-term trading. This indicator functions on the basis of the variation between the total number of issues on the New York Stock Exchange (NYSE) that are either declining or advancing.
To break this indicator down further, traders and analysts may see a limited number of stocks making significant gains in the market and thus presume that a bull market is in effect and that, in general, the market is functioning in a healthy way. However, the reality may be that the market is in a state of flux with rising market prices overall, in fact, being fueled by only a few stocks. The McClellan Oscillator is designed to recognize such a market condition and signal a potential turn from bull-to-bear market, or conversely from bear-to-bull.
Calculating the McClellan Oscillator
In order to calculate the McClellan Oscillator, you must subtract a 39-day exponential moving average (EMA) from a 19-day EMA. The EMA is calculated, as mentioned above, by determining the difference between advancing and declining issues. Simplifying the calculation into one formula looks something like this:
(19-Day EMA of Advances – Declines) – (39-Day EMA of Advances – Declines)
Using the McClellan Oscillator
The tricky aspect of using the McClellan Oscillator is knowing how to effectively interpret and manage the information that the indicator provides. Sometimes, movement is just movement and certain numbers that the oscillator provides aren’t inherently significant. However, in some circumstances, the oscillator can provide a trader with a crucial piece of information that will help them trade more effectively.
There are a number of comparisons that can be drawn between the McClellan Oscillator and the moving average convergence-divergence (MACD) indicator because they work in much the same way. To keep it simple, analysts and traders understand that when the oscillator is in the positive, the 19-day EMA is higher than the 39-day EMA, which is a signal that advancing securities are winning out over declining securities. If the oscillator falls into the negative, then the exact opposite is true–declining securities are considered to have the upper hand.
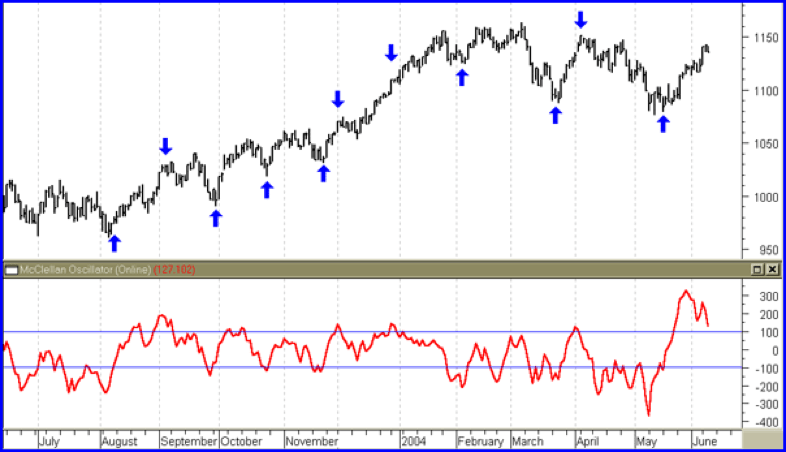
As is also true with the MACD indicator, when the McClellan Oscillator generates a positive reading, this is generally a good indication that the market is best suited for bullish investors. Negative readings, on the other hand, are generally a positive sign for bears. Other things for investors to note are divergences with stock pricing, as this can be a sign that the market is preparing for a reversal, as well as thrusts, which can be an indication that a longer period of movement – either higher or lower, depending on the thrust – is about to occur. The chart above shows a thrust in the McClellan Oscillator near the far right-hand side of the chart, a possible indication of an upcoming and substantial bullish movement. If you look back, you can see that another, smaller thrust in the indicator around the first of August correctly predicted a significant bullish move in the market.
Understanding Trend Strength
Sherman and Marian McClellan believed, as many analysts do, that when you assess a trend in the markets, newer, more recent price action movements are usually more relevant than older ones. Therefore, they chose to use an exponential moving average (EMA), as opposed to a simple moving average (SMA), in order to give more weight to recent market action. Essentially, the closest data point on the A/D line is taken into consideration, and then you continue to move down that line, continually multiplying each by a constant and a degree. For example, the second point would be multiplied by a constant squared, the third would be multiplied by a constant cubed, and so on. In this way, the larger the constant is, the more the moving average can be stacked toward the present time.
This understanding of trends also usually means that analysts and traders must dig into the past to understand where a trend began. The difficulty is knowing how far back to go. If you go only a day or two into the past, your results may be fairly easy to calculate in arithmetic terms, however, the information you glean will likely be fairly insignificant or will not be of much use to you today. If you go too far into the past, however, the mathematical calculations become infinitely more difficult, and deciphering the importance of different trends may be hard to sort out. The McClellan Oscillator uses practical timeframes – 19-day and 39-day periods – using a 5% and 10% smoothing constant for both. This procedure hopefully makes the data gleaned optimally useful and relevant.
In the End
At the end of the day, the market is constantly on the move and thus the McClellan Oscillator’s calculations, like those of any technical indicator, change regularly. If you choose to use this indicator to understand the market, do your best to assess the true value of the information that it is generating before you take action. As is the case with most oscillators, it can be difficult to discern between genuine and false signals, and analysts usually only become adept at using the McClellan Oscillator over a period of time, and in conjunction with using other technical indicators.


