Get Certified for
Capital Markets (CMSA®)
From equities and fixed income to derivatives, the CMSA certification bridges the gap from where you are now to where you want to be — a world-class capital markets analyst.
The ratio between the price trend of a stock price compared to the market's price trend
Relative price strength (RPS), also known as relative strength, is the ratio between the price trend of a stock price compared to the price trend of the market. RPS is commonly used in technical analysis and is not to be confused with relative price index.

The formula for RPS is as follows:

Where:
Alternatively, other metrics for the denominator, such as trend price of an industry or trend price of another stock, can be used depending on what the investor wants to compare against.
John is a momentum investor and is looking for a stock that grows the fastest compared to the market. The trend price of three different stocks in addition to the trend price of the market is provided. Based on RPS alone, which stock would John likely choose?
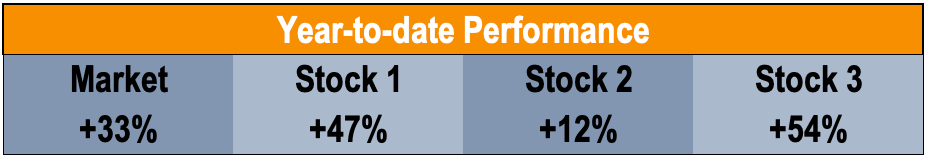
The RPS of Stock 1 is 47%/33% = 1.42.
The RPS of Stock 2 is 12%/33% = 0.36.
The RPS of Stock 3 is 54%/33% = 1.64.
Based on RPS alone, John would likely choose Stock 3.
Relative price strength is an indicator of price momentum. A higher RPS is always desirable. An RPS greater than 1.0 indicates that the stock outperformed the market. An RPS equal to 1.0 indicates that the stock performed identically to the market. An RPS lower than 1.0 indicates that the stock underperformed the market.
Relative price strength uses historical data – past performance is not indicative of future performance. Therefore, a stock with a higher RPS compared to another stock does not indicate that the stock is a better pick moving forward.
Relative price strength can be a misleading indicator because it does not take risk into account. The RPS is a pure comparison between returns and does not consider the risk taken to generate that return.
RPS should not be the sole determinant used when stock-picking. Additional technical indicators, including the moving average convergence divergence (MACD), simple moving average (SMA), and relative strength index (RSI), and fundamental analysis should be used in conjunction with the RPS.
Despite the perceived lack of usefulness of the RPS – why do investors use it?
Investors use RPS because they believe it provides insight into future price momentum. The usefulness of the RPS is based on the premise of momentum – stocks with increasing RPS is assumed to continue increasing. In addition, investors believe that companies with a high RPS will attract other investors to invest in the stock (thereby increasing the stock price).
Thank you for reading CFI’s guide on Relative Price Strength (RPS). To keep learning and advancing your career, the following resources will be helpful:


