
Get In-Demand Finance Certifications
Imagine a manager asking their new analyst about enterprise value, but the analyst accidentally explains market cap instead. They wouldn’t be alone. Learning finance terminology is often like learning a new language, and students often struggle to understand certain terms or concepts.
This breakdown explains 10 of the most commonly misunderstood terms in corporate finance, with clear explanations and quick takeaways to help you keep them straight. Whether you’re studying for an exam, prepping for interviews, or starting your first job in finance, this list is for you.

It’s a common myth that “if a company is profitable, it must be flush with cash.” After all, if a company is profitable, doesn’t that mean it has plenty of cash?
Not necessarily.
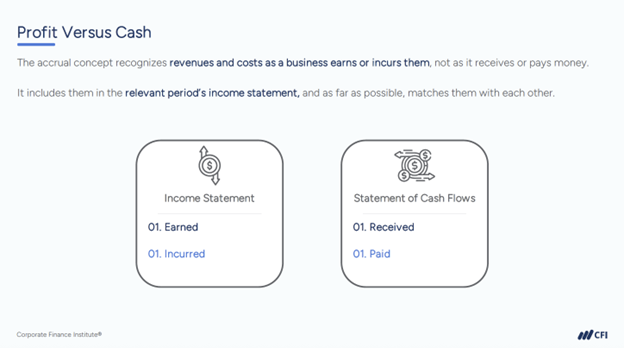
Profit (or net income) is what remains after all expenses are subtracted from revenue, including expenses that don’t actually require cash payments right now, such as depreciation. It represents the company’s earnings on the income statement.
Cash flow tracks actual money going in and out of the business. Suppose a company sells $100,000 of products in December but customers won’t pay until February. The profit shows up in December, but the cash doesn’t arrive until two months later. Meanwhile, the company still needs cash to pay employees and suppliers in January.
This distinction matters because profitable companies can still struggle with cash, making it difficult to pay bills or make payroll.
Bottom line: Profit is calculated on paper. Cash flow is money in the bank.
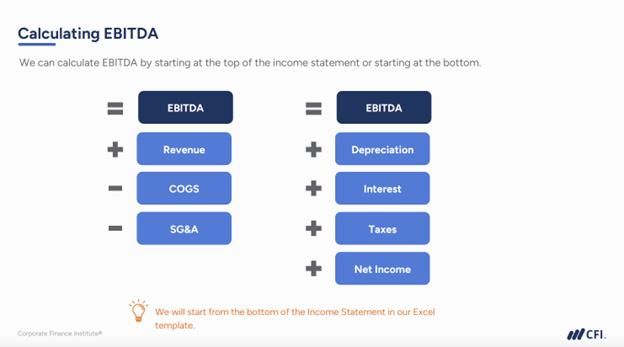
EBITDA stands for Earnings Before Interest, Taxes, Depreciation, and Amortization. Think of it like looking at your total salary before any deductions. It shows what a company earns from its core business before factoring in how it’s financed, what it owes in taxes, or how its equipment loses value over time.
Analysts frequently use EBITDA to compare companies fairly. Imagine comparing two restaurants: one has very little debt, while the other has lots of debt. Since it’s calculated before a company pays interest on its debt, EBITDA strips away these differences to show how well each restaurant actually makes money from selling food and managing payroll.
Bottom line: EBITDA reflects earnings from core operations, making it easier to compare different companies, but it excludes costs like financing costs and taxes.
When someone says a company is “worth” a certain amount, they’re often referring to market capitalization (market cap). Market cap is calculated as share price times the number of outstanding shares. It tells you what the market thinks the company’s shares are worth.
Enterprise Value (EV) is the total value of a business, including its market capitalization and debt minus cash and cash equivalents. Analysts use EV as a more comprehensive alternative to market capitalization. EV also gives investors a more comprehensive picture of what it would cost to acquire a company outright.
Bottom line: Market cap reflects the market’s view on the worth of a company’s shares. Enterprise value includes debt and cash to show the full picture.
CapEx and OpEx are both business costs, but they represent fundamentally different types of spending.
CapEx (capital expenditures) is money spent on assets that provide long-term value, like equipment, buildings, or technology. These costs don’t hit the income statement all at once. Instead, they appear on the balance sheet as assets and are expensed over the useful life of the asset through depreciation. For example, buy a $50,000 delivery truck and you might reduce income by $10,000 per year for five years as the truck loses value.
OpEx (operating expenses) are day-to-day costs like rent, salaries, utilities, and marketing. These appear directly on the income statement and reduce profit immediately in the period they occur. Rent that same $50,000 truck for one year, and the full $50,000 hits your income statement that year.
Bottom line: CapEx buys future value. OpEx keeps the business running now.
Revenue (or sales) is the total amount a company earns from selling its products or services. It sits at the top of the income statement, which is why it’s often called “top line.”
Profit (or net income) is what’s left after subtracting all costs: operating expenses, interest, taxes, and depreciation. That’s the “bottom line.”
A company can generate impressive revenue and still be unprofitable if its costs are too high. For example, a startup might bring in $10 million in revenue but report a $2 million loss if it spent $12 million on operations, payroll, and marketing.
Bottom line: Remember the saying “revenue is vanity, profit is sanity.” Revenue shows total sales, but profit shows how much the company actually kept after all its expenses.
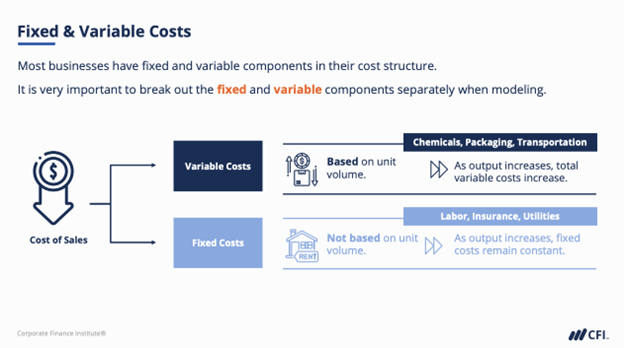
Both are costs, but they behave very differently as business activity changes.
Fixed costs stay the same regardless of production volume. Think rent, salaries, and insurance. These are costs you pay no matter what.
Variable costs rise or fall with production. The more units you make or sell, the more you spend on materials, packaging, or commissions.
Why does this matter? A company with mostly fixed costs sees profits soar when sales increase (since costs don’t rise much) but suffers when sales drop (costs remain high). This mix determines your leverage (see the next section) and break-even point — critical for planning and forecasting.
Bottom line: Fixed costs don’t change with volume. Variable costs move with activity.
Leverage refers to the strategic use of resources or tools to amplify the potential return of an investment or enhance business performance.
Financial leverage and operating leverage are two types of leverage affecting earnings.
Financial leverage comes from using borrowed money (debt) to fund the business. For example, a company might take on debt to grow faster or gain market share. While leverage can help with growth, it also increases the risk of losses if things don’t go as planned.
Operating leverage comes from having high fixed costs relative to variable costs. When revenue increases and costs stay the same, profit rises. But when revenue falls and fixed costs remain unchanged, profitability comes under pressure.
Bottom line: Financial leverage comes from debt. Operating leverage comes from fixed costs. Both can boost gains or magnify losses.
These two terms both describe a company’s value, but they come from completely different places.
Book value is the accounting value of a company’s equity: assets minus liabilities. It’s recorded on the balance sheet and generally reflects historical costs, not current prices. For example, if a company bought a building for $10 million five years ago, that $10 million (minus depreciation) stays on the books even if the building is now worth $15 million.
Market value typically refers to market capitalization, or the price investors are willing to pay for the company’s equity. It captures expectations about future growth, profitability, and risk. A tech company might have a $50 million book value but a $500 million market value because investors value its growth potential.
Bottom line: Book value is backward-looking and based on accounting. Market value is forward-looking and based on investor perception.
Liquidity measures whether a company has enough cash and cash equivalents to cover immediate obligations. A company with $1 million in the bank but $2 million in bills due next week has a liquidity problem.
Solvency tells you if a company has a sustainable business model and manageable debt levels to survive in the long term. You can determine if a company is solvent if its total assets exceed total liabilities and it generates enough profit to service its debts.
Bottom line: Liquidity keeps the lights on today. Solvency ensures you’ll still be in business tomorrow.
Both are “return” ratios, but they measure different things for different audiences.
ROI (Return on Investment) measures the return on a specific project or initiative. It’s calculated as (Gain – Cost) / Cost × 100%. If you spend $10,000 on new software and it saves $15,000, your ROI is 50%. Marketing teams use ROI to evaluate campaigns.
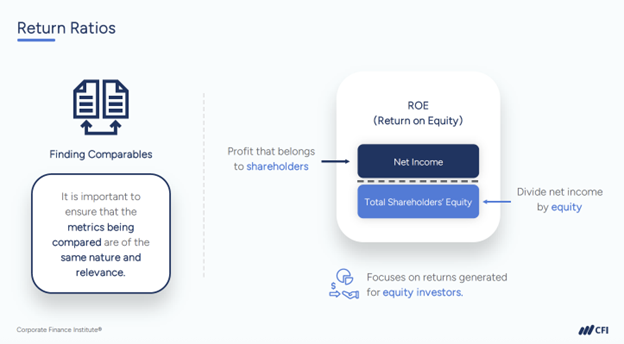
ROE (Return on Equity) measures how effectively a company uses shareholders’ equity to generate profit. It’s calculated as Net Income / Shareholders’ Equity × 100%. If a company generates $2 million profit with $10 million in equity, ROE is 20%. Investors use ROE to compare company efficiency.
Bottom line: ROI measures specific project returns. ROE shows how well the entire company uses shareholder funds.
Understanding the meanings and distinctions among these key financial terms is foundational for learning how to analyze the financial health of businesses, evaluate investments, and assess risks.
Ready to further your journey in finance? Explore CFI’s comprehensive course catalog and certification programs to build the skills you need for your chosen path. Whether you’re interested in financial modeling, corporate finance, or investment banking, CFI’s structured learning paths can help you achieve your finance career goals.
Top Professional Finance Certifications


