Get Certified for
Business Intelligence (BIDA®)
Develop analytical superpowers by learning how to use programming and data analytics tools such as VBA, Python, Tableau, Power BI, Power Query, and more.
Calculates the binomial distribution probability for the number of successes from a specified number of trials
The BINOM.DIST Function[1] is categorized under Excel Statistical functions. It calculates the binomial distribution probability for the number of successes from a specified number of trials. This binomial distribution Excel guide will show you how to use the function, step by step.
The binomial distribution is a statistical measure that is frequently used to indicate the probability of a specific number of successes occurring from a specific number of independent trials. The two forms used are:
In financial analysis, the BINOM.DIST function can be useful in finding out, for example, the probability of publishing a best-selling book from a range of books to be published by a company.
Introduced in Excel 2010, BINOM.DIST function is an updated version of the BINOMDIST function.
=BINOM.DIST(number_s,trials,probability_s,cumulative)
The BINOM.DIST uses the following arguments:
To learn more, launch our free Excel crash course now!
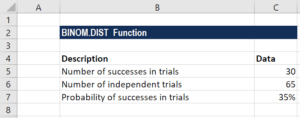
To understand the uses of the BINOM.DIST function, let us consider an example:
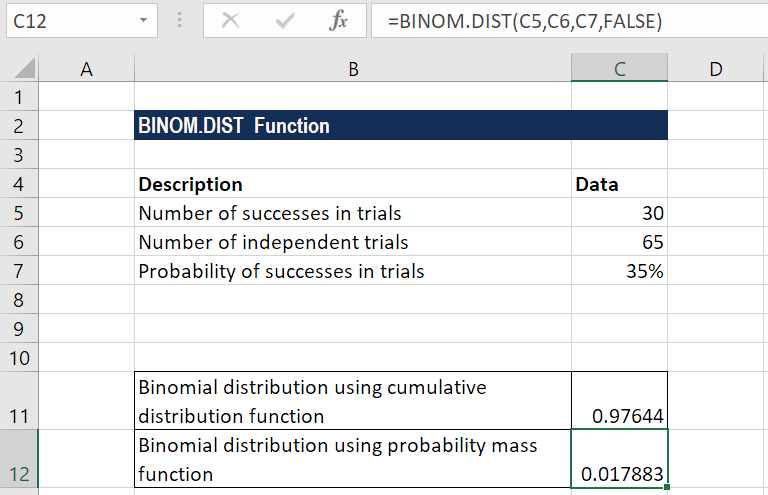
Suppose we are given the following data:
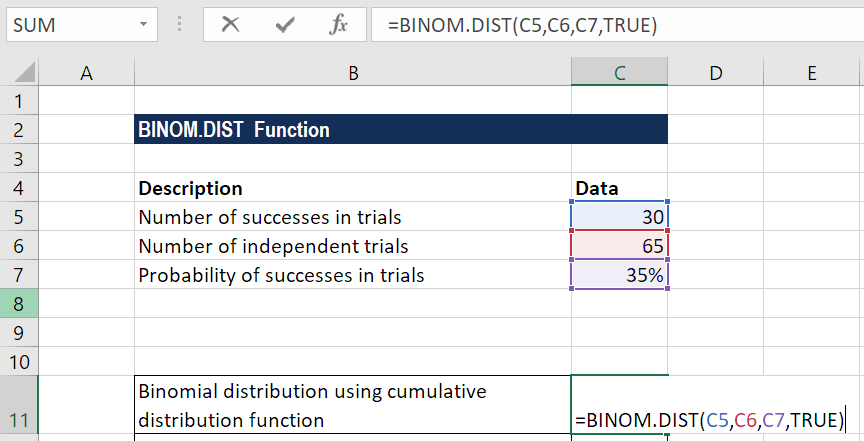
The formula for calculating binomial distribution using the cumulative distribution function is shown below:
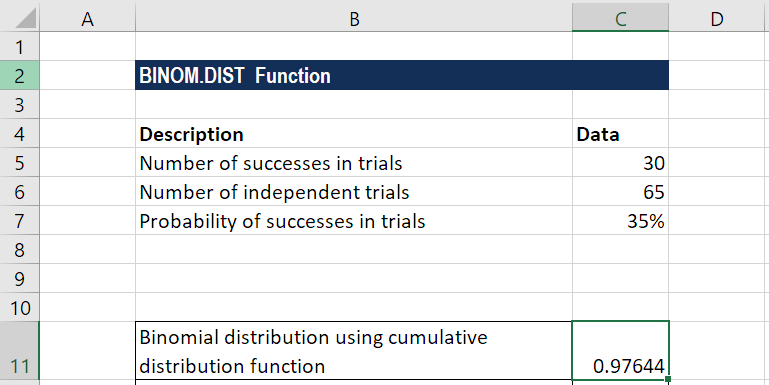
We get the result below:
The formula for calculating binomial distribution using the probability mass function is shown below:
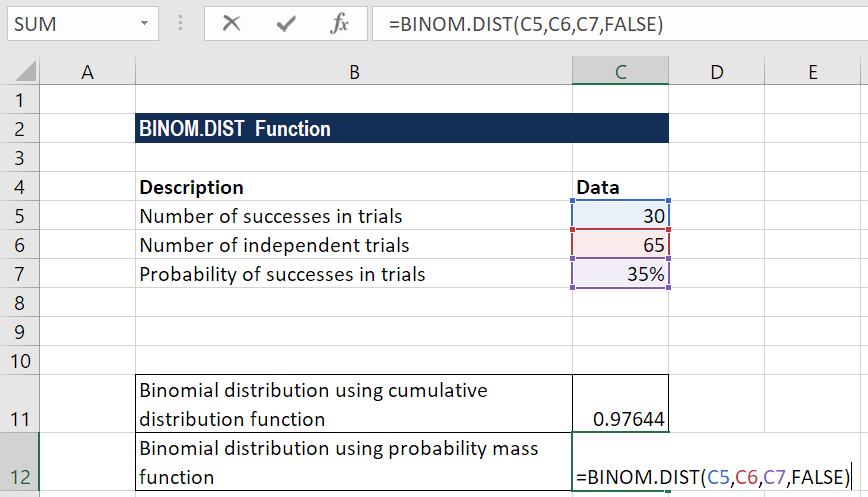
We get the result below:
Thanks for reading CFI’s guide to the binomial distribution function in Excel! By taking the time to learn and master these functions, you’ll significantly speed up your financial analysis. To learn more, check out these additional CFI resources:
To master the art of Excel, check out CFI’s Excel Crash Course, which teaches you how to become an Excel power user. Learn the most important formulas, functions, and shortcuts to become confident in your financial analysis.

Launch CFI’s Excel Crash Course now to take your career to the next level and move up the ladder!


