F.DIST Function
Calculates the probability density function or the Cumulative Distribution Function for the F Distribution
What is the F Distribution Function?
The F.DIST Function[1] is categorized under Excel Statistical functions. It will calculate the probability density function or the Cumulative Distribution Function for the F Distribution. It measures the degree of diversity between two data sets.
For example, if we wish to find out the variability in the IQ scores of females vis-à-vis males, we can use the F.DIST function to examine it.
As a financial analyst, the function is useful in risk management. We can use it to understand and evaluate the extent of potential losses that a portfolio can suffer.
F Distribution Formula
=F.DIST(x,deg_freedom1,deg_freedom2,cumulative)
The F.DIST function uses the following arguments:
- X (required argument) – This is the value at which we evaluate the function.
- Deg_freedom1 (required argument) – This is an integer specifying numerator degrees of freedom.
- Deg_freedom2 (required argument) – An integer specifying denominator degrees of freedom.
- Cumulative (required argument) – This is a logical value that determines the type of F distribution to be calculated. It can either be TRUE (uses the cumulative distributive function) or FALSE (uses the probability density function).
To learn more, launch our free Excel crash course now!
How to use the F Distribution Function in Excel?
To understand the uses of the F.DIST function, let’s consider an example:
Example
Suppose we are given the following data:
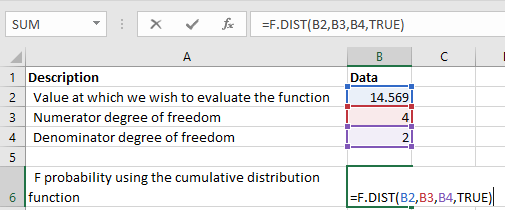
- Value at which we wish to evaluate the function: 14.569
- Numerator degree of freedom: 4
- Denominator degree of freedom: 2
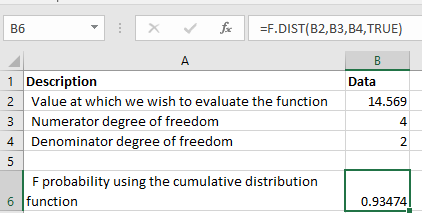
To find out the F probability using the cumulative distribution function, which is the TRUE cumulative argument, we will use the following formula:
We get the result below:
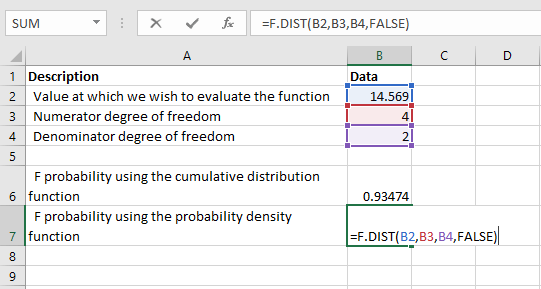
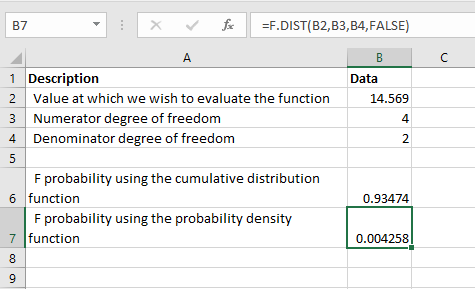
To find out the F probability using the probability density function, which is the FALSE cumulative argument, we will use the following formula:
We get the result below:
Things to remember about the F.DIST Function
- If either deg_freedom1 or deg_freedom2 is a decimal number, it is truncated to integers by Excel.
- #NUM! error – Occurs if either:
- The value of x provided is less than 0.
- The argument deg_freedom1 or deg_freedom2 is less than 1.
- #VALUE! error – Occurs when any of the arguments provided is non-numeric.
Additional Resources
Thanks for reading CFI’s guide to important Excel functions! By taking the time to learn and master these functions, you’ll significantly speed up your financial analysis. To learn more, check out these additional CFI resources:
- Excel Functions for Finance
- Advanced Excel Formulas Course
- Excel Shortcuts for PC and Mac
- F.DIST.RT Function
- FVSCHEDULE Function
- See all Excel resources
Article Sources
Excel Tutorial
To master the art of Excel, check out CFI’s Excel Crash Course, which teaches you how to become an Excel power user. Learn the most important formulas, functions, and shortcuts to become confident in your financial analysis.

Launch CFI’s Excel Crash Course now to take your career to the next level and move up the ladder!


