FORECAST.LINEAR Function
Calculates a future value using linear progression
What is the FORECAST.LINEAR Function?
The FORECAST.LINEAR Function[1] is categorized under Excel Statistical functions. It will calculate or predict a future value using linear regression.
In financial modeling, the FORECAST.LINEAR function can be useful in calculating the statistical value of a forecast made. For example, if we know the past earnings and expenses that are a certain percentage of sales, we can forecast the future amounts using the function.
Formula
=FORECAST.LINEAR(x, known_y’s, known_x’s)
The FORECAST.LINEAR function uses the following arguments:
- X (required argument) – This is a numeric x-value for which we want to forecast a new y-value.
- Known_y’s (required argument) – The dependent array or range of data.
- Known_x’s (required argument) – This is the independent array or range of data that is known to us.
How to use the FORECAST.LINEAR Function in Excel?
As a worksheet function, FORECAST.LINEAR can be entered as part of a formula in a cell of a worksheet. To understand the uses of the function, let’s look at an example:
Example
Suppose we are given earnings data below, which are the known x’s, and expenses, which are the known y’s. We can use the FORECAST.LINEAR function to predict an additional point along the straight line of best fit through a set of known x- and y-values.
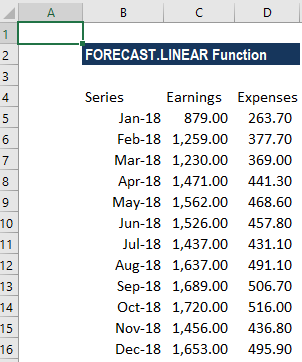
Using the earnings data for January 2019, we can predict the expenses for the same month using the FORECAST.LINEAR function.
The formula to use is:
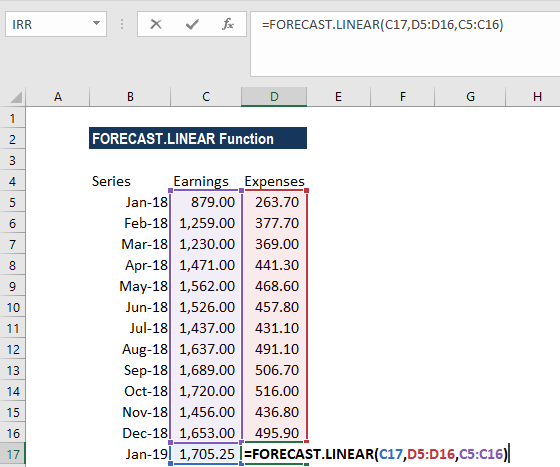
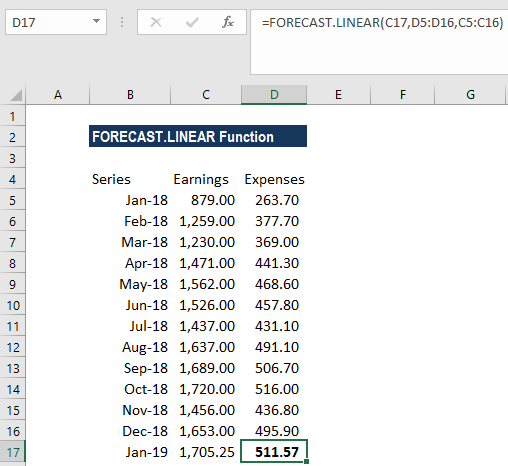
We get the results below:
The FORECAST.LINEAR function will calculate a new y-value using the simple straight-line equation:
![]()
Where:
![]()
and:
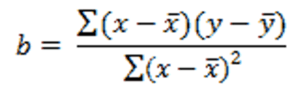
The values of x and y are the sample means (the averages) of the known x- and the known y-values.
A few pointers about the FORECAST.LINEAR Function:
- The length of the known_x’s array should be the same as that of the known_y’s, and the variance of the known_x’s must not be zero.
- The FORECAST.LINEAR function was introduced in Excel 2016 (to replace the old FORECAST function). The FORECAST.LINEAR function is no longer available in earlier versions of Excel. It is also not available in Excel 2016 for Mac.
- #N/A error – Occurs if the supplied known_x’s and the supplied known_y’s arrays are of different lengths.
- #DIV/0! error – Occurs if the variance of the supplied known_x’s is equal to zero.
- #VALUE! error – Occurs if the given future value of x is non-numeric.
Click here to download the sample Excel file
Additional Resources
Thanks for reading CFI’s guide to the Excel FORECAST.LINEAR function. By taking the time to learn and master these functions, you’ll significantly speed up your financial analysis. To learn more, check out these additional CFI resources:
- All Excel Articles
- Advanced Excel Course
- Excel Modeling Templates
- Excel Shortcuts for PC and Mac
- See all Excel resources
Article Sources
Excel Tutorial
To master the art of Excel, check out CFI’s Excel Crash Course, which teaches you how to become an Excel power user. Learn the most important formulas, functions, and shortcuts to become confident in your financial analysis.

Launch CFI’s Excel Crash Course now to take your career to the next level and move up the ladder!


