T.DIST.RT Function
Calculates the right-tailed student's t-distribution
What is the T.DIST.RT Function?
The T.DIST.RT Function[1] is categorized under Excel Statistical functions. It will calculate the right-tailed student’s T distribution. The student’s T distribution is a continuous probability distribution that is frequently used in testing hypotheses on small sample data sets.
As a financial analyst, T.DIST.RT is used in portfolio risk analysis. It is used to model asset returns to take care of heavy tails. This is so as the T distribution includes fatter tails, which give higher values of value-at-risk at high confidence levels.
The T.DIST.RT function replaced the TDIST function in MS Excel 2010.
Formula
=T.DIST.RT(x, deg_freedom)
The T.DIST.RT function uses the following arguments:
- X (required argument) – This is the numeric value at which we wish to evaluate the right-tailed student’s T Distribution.
- Deg_freedom (required argument) – This is an integer that indicates the number of degrees of freedom. It must be greater than or equal to 1.
How to use the T.DIST.RT Function in Excel?
To understand the uses of the T.DIST.RT function, let’s consider a few examples:
Example 1
Suppose we are given the data below:
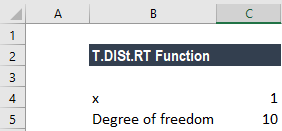
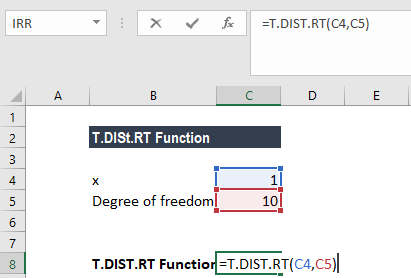
As we want to calculate the value of the function at x = 1 with a degree of freedom of 10, we will use the formula below:
We get the result below:
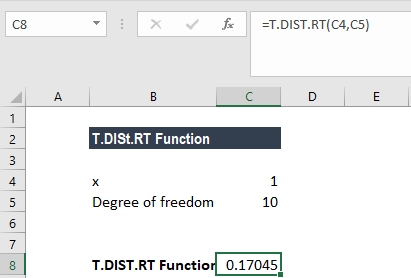
The result we get is 17.04%.
Example 2
Suppose we are given the following data:
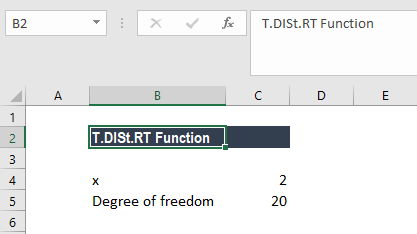
As we want to calculate the value of the function at x = 2 with a degree of freedom as 20, we will use the formula below:
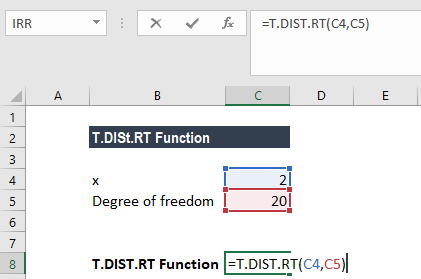
We get the result below:
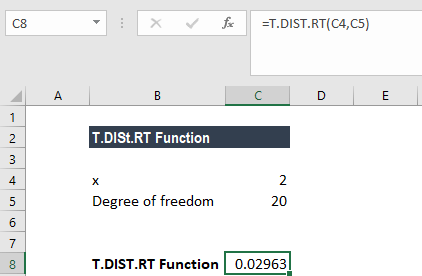
The result we get is 2.96%.
Things to remember about the T.DIST.RT Function
- #NUM! error – Occurs when the deg_freedom argument provided is <1.
- #VALUE! error – Occurs when the given arguments are non-numeric.
- The deg_freedom and tails arguments are truncated to integers.
- We can use the T.DIST.RT function in place of a table of critical values for the T distribution.
Click here to download the sample Excel file.
Additional Resources
Thanks for reading CFI’s guide to important Excel functions! By taking the time to learn and master these functions, you’ll significantly speed up your financial analysis. To learn more, check out these additional CFI resources:
- Excel Functions for Finance
- Advanced Excel Formulas Course
- Advanced Excel Formulas You Must Know
- CHISQ.DIST.RT Function
- See all Excel resources
Article Sources
Excel Tutorial
To master the art of Excel, check out CFI’s Excel Crash Course, which teaches you how to become an Excel power user. Learn the most important formulas, functions, and shortcuts to become confident in your financial analysis.

Launch CFI’s Excel Crash Course now to take your career to the next level and move up the ladder!


