T.TEST Function
Calculate the probability that is associated with a Student’s T-Test
What is the T-TEST Function?
The T.TEST Function[1] is categorized under Excel Statistical functions. It will calculate the probability that is associated with a Student’s T-Test. The function is commonly used to test the probability of two samples that have underlying populations with the same mean.
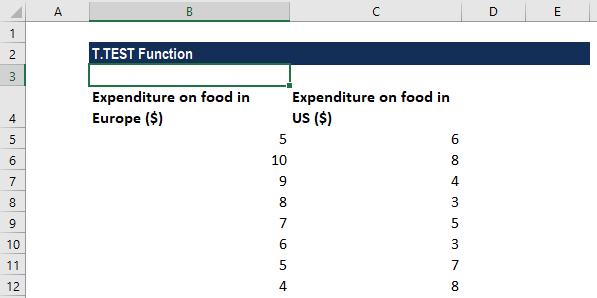
In financial analysis, suppose we wish to understand the amount spent by Europeans and Americans on food. We cannot practically record the spending habits of every European and American, so we would take a sample of each population. In such a scenario, T-test will help us find the answer to the question of whether the difference in food spending of the two groups is representative of a true difference between Europeans and Americans in general or if it is just a meaningless statistical difference.
Formula
=T.TEST(array1,array2,tails,type)
The formula uses the following arguments:
- Array1 (It is a required argument) – The first data set.
- Array2 (It is a required argument) – The second data set.
- Tails (It is a required argument) – Specifies if it is a one-tailed or two-tailed test. If tails = 1, T-TEST uses the one-tailed distribution. If tails = 2, T-TEST uses the two-tailed distribution.
- Type (It is a required argument) – The type of t-test to perform:
- 1 – Performs a paired t-test.
- 2 – Two-sample equal variance t-test.
- 3 – Two-sample unequal variance t-test.
How to Use the T-TEST Function in Excel?
To understand the uses of the T.TEST function, let’s consider a few examples:
Example 1 – Perform a T-Test calculation in Excel
Suppose we are given the following data on the money spent by households in Europe and the US. As the samples are independent of one another, we use the two-sample t-test. Let’s say we want to test if the means between these two data-sets are significantly different, which are Europe $X.XX and US $X.XX. We can use the T-test for that.
The value associated with the Student’s paired t-test with a one-tailed distribution for the two arrays of data above can be calculated using the Excel function. The formula used is as follows:
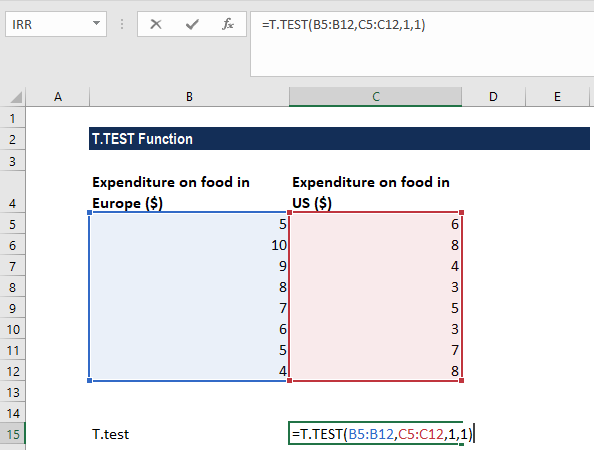
We get the result below:
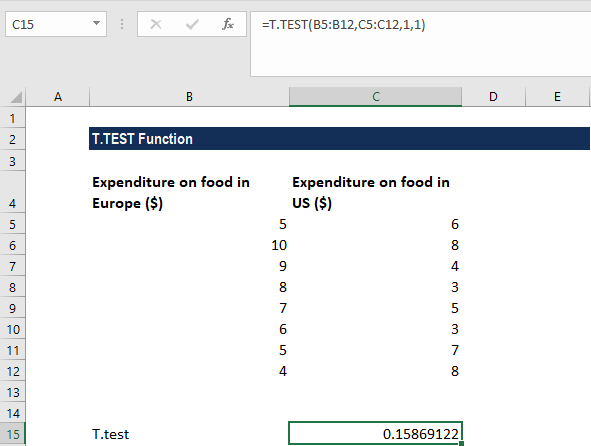
What Does the Value Mean?
In the example above we have calculated the p-value for the t.test. When conducting hypothesis testing, it is important to set the null and alternative hypothesis.
Things to Remember about the T-TEST Function
- #NUM! error – Occurs when:
- The given tails argument has any value other than 1 or 2.
- The given type argument is not equal to 1,2, or 3.
- #N/A! error – Occurs when the two supplied arrays are of different lengths.
- #VALUE error – Occurs when either the given tails argument or the supplied type argument is non-numeric.
Click here to download the sample Excel file
Additional Resources
Thanks for reading CFI’s guide to the Excel T-test function. By taking the time to learn and master these functions, you’ll significantly speed up your financial analysis. To learn more, check out these additional CFI resources:
- Excel Functions for Finance
- Advanced Excel Formulas Course
- Advanced Excel Formulas You Must Know
- Excel Shortcuts for PC and Mac
- See all Excel resources
Article Sources
Excel Tutorial
To master the art of Excel, check out CFI’s Excel Crash Course, which teaches you how to become an Excel power user. Learn the most important formulas, functions, and shortcuts to become confident in your financial analysis.

Launch CFI’s Excel Crash Course now to take your career to the next level and move up the ladder!


