T.INV Function
Calculates the left-tailed student's t-distribution
What is the T.INV Excel Function?
The T.INV Excel Function[1] is categorized under Statistical functions. It will calculate the left-tailed student’s t-distribution. The student’s t-distribution is a continuous probability distribution that is frequently used in testing hypotheses on small sample data sets.
As a financial analyst, the T.INV function is used in portfolio risk analysis, particularly, the risk-return relationship of a portfolio. The function is often used when the sample size is smaller, i.e., when a portfolio is comprised of only 20 stocks or 5 asset classes.
T.INV Formula
=T.INV(probability,deg_freedom)
The T.INV function uses the following arguments:
- Probability (required argument) – This is the probability associated with the Student’s T Distribution.
- Deg_freedom (required argument) – This is the number of degrees of freedom with which to characterize the distribution.
How to use the T.INV Excel Function
To understand the uses of the T.INV function, let us consider a few examples:
Example 1
Suppose we are given the following data:
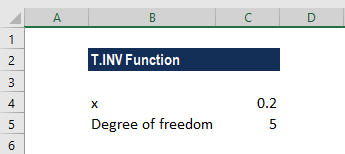
If we want to calculate the value of the function for a probability of 0.20, the formula to use is:
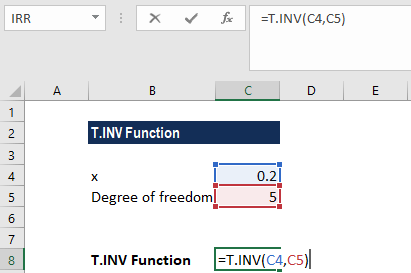
We get the result below:
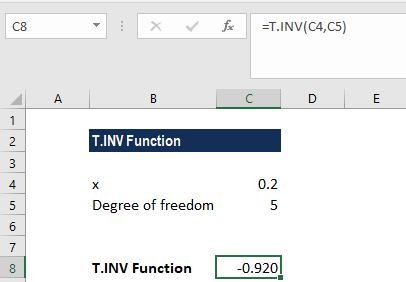
So, the left-tailed inverse of the student’s t-distribution with a probability of 20% and 5 degrees of freedom is -0.920.
Example 2
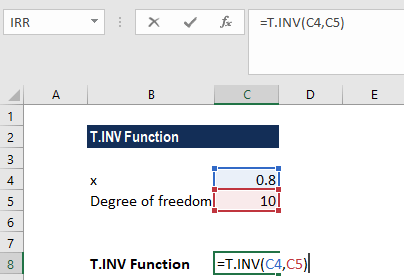
Suppose we are given the following data:
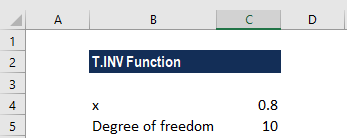
If we want to calculate the value of the function for a probability of 0.80, the formula to use is:
We get the result below:
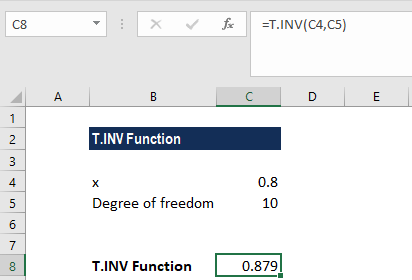
So, the left-tailed inverse of the student’s t-distribution with a probability of 80% and 10 degrees of freedom is 0.879.
Things to remember about the T.INV Excel Function
- #NUM! error – Occurs when:
- The given probability is less than or equal to zero or is greater than one.
- The given deg_freedom is less than 1.
- #VALUE! error – Occurs when one or both of the supplied arguments are non-numeric.
- If deg_freedom is not an integer, it is truncated.
Click here to download the sample Excel file
Additional Resources
Thanks for reading CFI’s guide to important Excel functions! By taking the time to learn and master these functions, you’ll significantly speed up your financial analysis. To learn more, check out these additional CFI resources:
- Excel Functions for Finance
- Advanced Excel Formulas You Must Know
- Excel Shortcuts for PC and Mac
- T.INV.2T Function
- See all Excel resources
Article Sources
Excel Tutorial
To master the art of Excel, check out CFI’s Excel Crash Course, which teaches you how to become an Excel power user. Learn the most important formulas, functions, and shortcuts to become confident in your financial analysis.

Launch CFI’s Excel Crash Course now to take your career to the next level and move up the ladder!


