VAR.P Function
Returns the variance of a given set of values
What is the VAR.P Function?
The VAR.P Function[1] is categorized under Excel Statistical functions. This function will return the variance of a given set of values. It was introduced in MS Excel’s 2010 version.
Variance is a statistical measure used across a set of values to identify the amount that the values vary from the average value.
As a financial analyst, the VAR.P function can be useful in calculating variances in revenue. Portfolio managers often use the function to measure and keep a track of their portfolios’ risk.
Formula
=VAR.P(number1,[number2],…)
The VAR.P function uses the following arguments:
- Number1 (required argument) – This is the first argument corresponding to a population.
- Number 2,.. (optional argument) – Here, the number arguments can be up to 254 values or arrays of values that provide at least two values to the function.
When providing the arguments, we need to remember that:
- VAR.P assumes the given data represents the entire population. If data represents a sample, compute variance with VAR.S.
- VAR.P only evaluates numbers in references, ignoring empty cells, text, and logical values like TRUE or FALSE.
- Arguments can either be numbers or names, arrays, or references that contain numbers.
- Arguments can be hard-coded values instead of references.
- To evaluate logical values and/or text, use the VARPA function.
How to use VAR.P Function in Excel?
As a worksheet function, VAR.P can be entered as part of a formula in a worksheet cell. To understand the uses of the function, let’s see an example:
Example
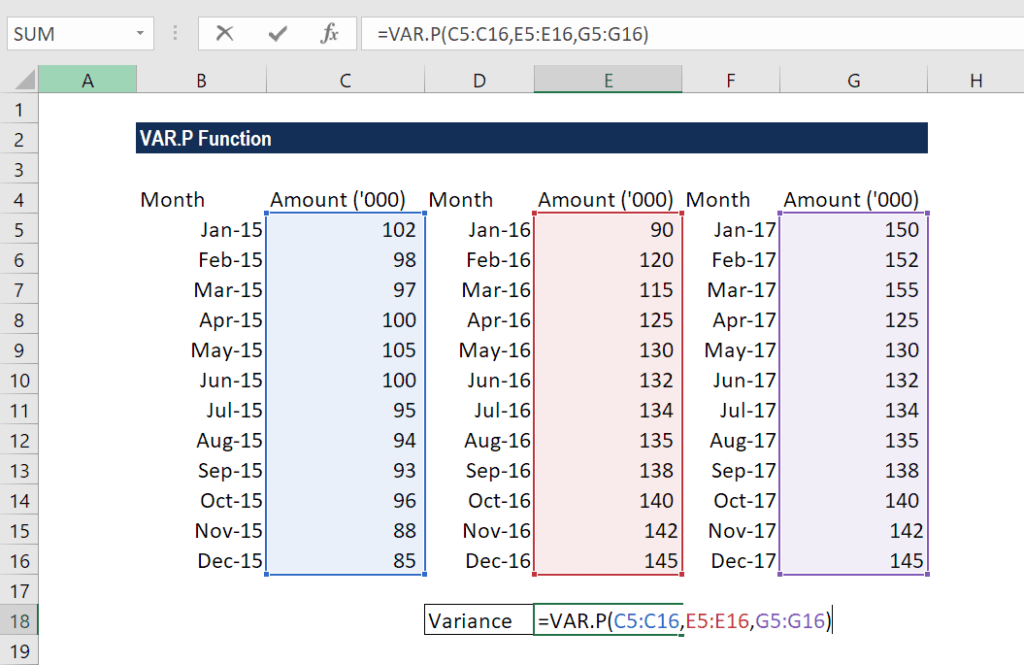
Suppose we are given the monthly sales figures of a business over the last three years, as shown below:
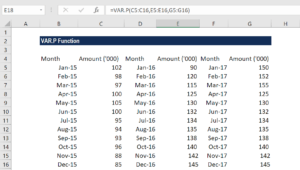
For the variance of the given population, the formula used is:
We get the results below:
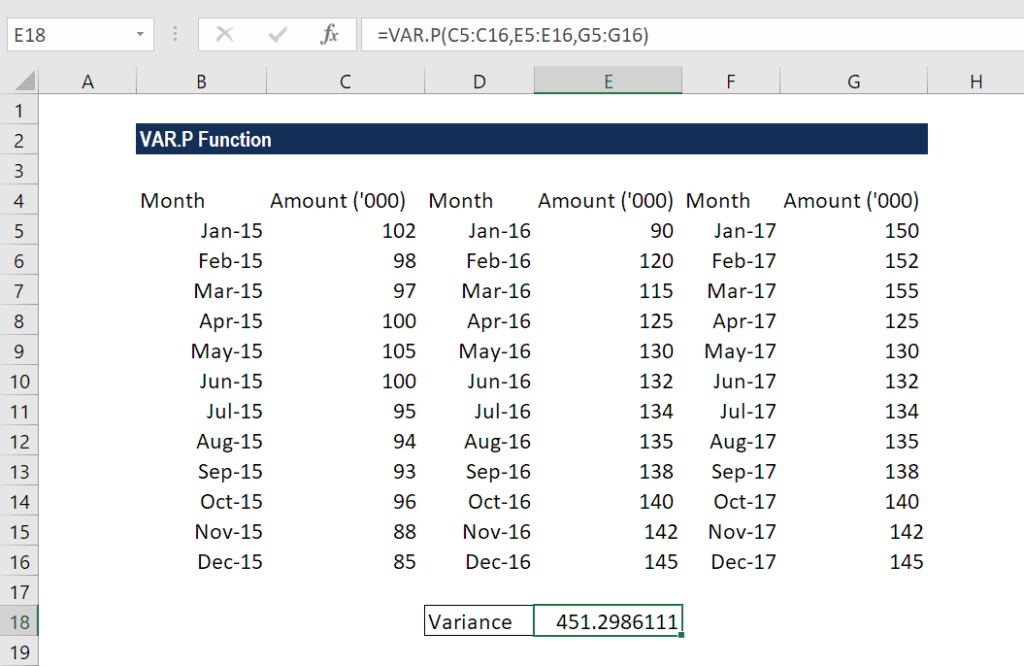
In the example above, we took the arguments for the VAR.P function as input in the form of three cell ranges. However, we can also enter the figures directly, either as individual numbers or number arrays.
A few things to remember about the VAR.P Function
- #DIV/0! error – Occurs if we did not provide any numeric values as arguments.
- #VALUE! error – Occurs when any of the values provided directly to this function are text values that cannot be interpreted as numbers.
- VAR.P function is used when calculating the variance of an entire population. If your data is just a sample of the population, you should use the VAR.S function.
Click here to download the sample Excel file
Additional Resources
Thanks for reading CFI’s guide to the Excel VAR.P function. By taking the time to learn and master these functions, you’ll significantly speed up your financial modeling. To learn more, check out these additional CFI resources:
- Excel Functions for Finance
- Advanced Excel Formulas Course
- Advanced Excel Formulas You Must Know
- Excel Shortcuts for PC and Mac
- See all Excel resources
Article Sources
Excel Tutorial
To master the art of Excel, check out CFI’s Excel Crash Course, which teaches you how to become an Excel power user. Learn the most important formulas, functions, and shortcuts to become confident in your financial analysis.

Launch CFI’s Excel Crash Course now to take your career to the next level and move up the ladder!


