Get Specialized with our Financial Planning & Analysis (FP&A) Program
Support business leaders in their decision-making with best-in-class financial models to evaluate and forecast the financial performance of a company.
Financial statement aggregation transforms granular monthly data into meaningful quarterly and annual views that enhance your models and streamline reporting. As an FP&A professional, consolidating detailed financial information helps identify performance trends and seasonal patterns, and enables effective variance analysis between periods.
This guide explores practical methods for aggregating financial statement data into structured quarterly and annual summaries using Excel techniques.

Creating a robust framework for financial statement aggregation begins with a thoughtful tab structure. Most financial models separate detailed monthly calculations from aggregated views, typically using a dedicated “Totals” tab for quarterly and annual summaries.
Start by designing your totals tab to mirror the exact structure of your detailed financial statements. When your income statement on the model tab has the same line items, spacing, and organization as your totals tab, you’ll save significant time copying formulas throughout your model.
This structural alignment is particularly important when aggregating income statements. Maintaining the same sequence of revenue, expenses, and profitability metrics ensures accurate summaries across all time periods.
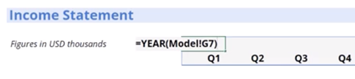
Dynamic period headings form the backbone of your aggregation framework. To create these:
⬇️
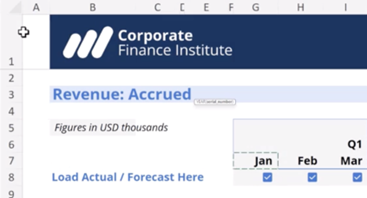
Implementing intelligent actuals vs. forecast indicators adds significant value to your aggregated statements. Rather than manually tracking which periods contain actual results:
This framework builds a foundation where aggregated views instantly reflect changes made to detailed monthly data.
By investing time in proper setup — organizing your structure, period indicators, and status trackers — you’ll establish a repeatable framework. This approach clearly distinguishes between historical results and forecasted periods. It also creates consistency in how financial information appears to stakeholders, whether they’re viewing monthly, quarterly, or annual data.
The SUMIFS Function in Excel precisely aggregates monthly data while maintaining the sign conventions established in your model. It allows you to sum values that meet multiple criteria — ideal for consolidating monthly financial data into quarterly views.
The basic SUMIFS structure for quarterly aggregation looks like this:

When aggregating financial statements, your sum_range will typically be the row of financial data you’re consolidating (revenue, expenses, etc.). Your criteria ranges identify which months belong to specific quarters and years.
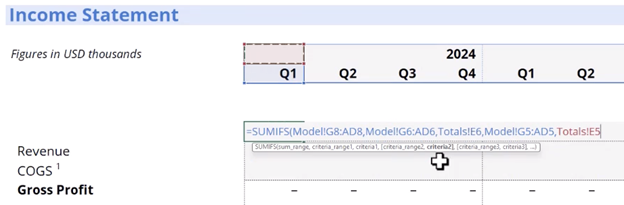
The power of SUMIFS for financial statement aggregation comes from proper cell reference locking. For formulas that work when copied both horizontally and vertically:
For example, when using a quarterly reference as criteria, lock only the row reference. This ensures the reference adjusts appropriately when copied across periods but remains fixed when copied down through your financial statements.
Once you’ve mastered the SUMIFS approach, you can efficiently apply it throughout your income statement. Start with revenue and work your way down through expenses, operating profit, and net income. The sign conventions established in your model tab (positive for favorable items, negative for unfavorable) will carry through your aggregation formulas.
The value of proper cell reference locking becomes evident as you copy these formulas. With appropriately locked references, you can select a row of quarterly formulas and copy them down through your entire income statement. Each row will automatically pull the correct monthly data, saving significant time and reducing formula errors.
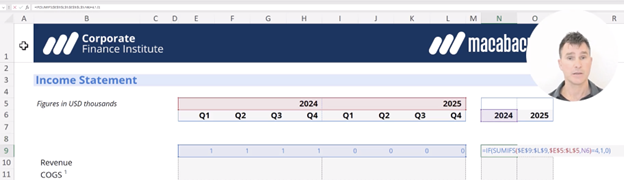
Building annual views follows the same fundamental approach as quarterly aggregation but with simplified criteria.

Unlike quarterly aggregation, annual views require only the year as filtering criteria, making formulas more compact. Key differences include:
When implementing annual views alongside quarterly, build and test quarterly formulas first, then adapt them for annual sections to maintain consistency across time periods.
Different financial statements require specific approaches when aggregating:
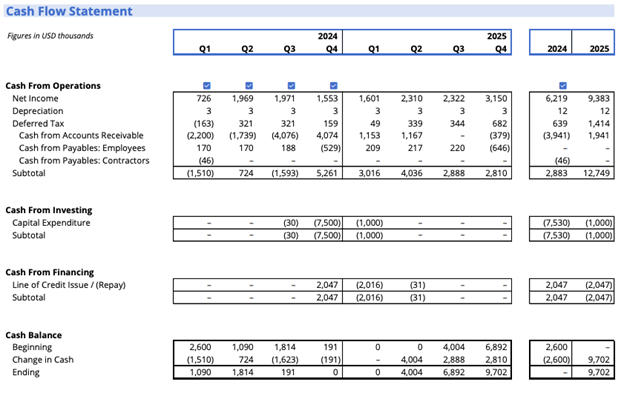
Cash flow statements require attention to sign conventions (inflows positive, outflows negative) and their “corkscrew” structure:
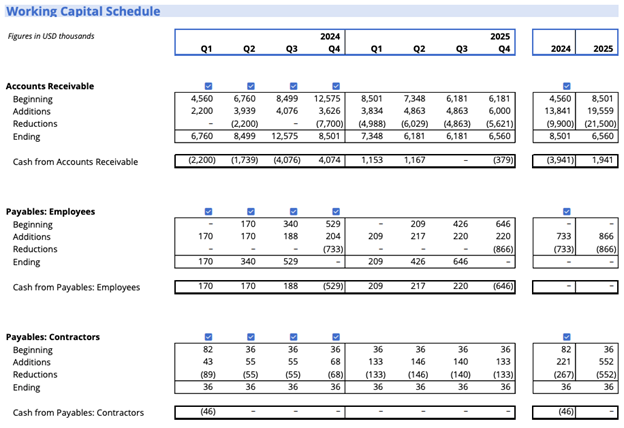
Working capital components like accounts receivable (A/R) and accounts payable (A/P) require attention to beginning and ending balances when creating aggregated views.
For each component:
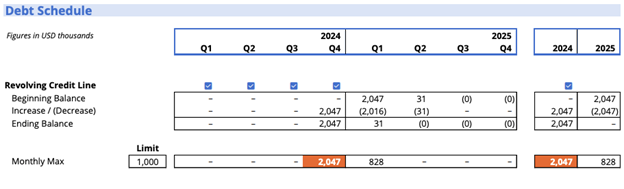
Using MAXIFS for Debt Ceiling Reporting
When dealing with debt schedules, particularly revolving credit facilities with established limits, you’ll often need to track the maximum utilization rather than the sum.
Applying these specialized techniques gives you views that provide meaningful insights across different time horizons, helping you track performance trends more effectively.
With an understanding of financial statement aggregation techniques, integrate them into your workflow by starting with one statement type and expanding to others. Develop standardized Excel templates with proper formula structures to ensure consistent reporting across your organization.
Enhance your aggregated data with visualizations that highlight key trends across time periods. As you apply these aggregation methods, focus on creating views that deliver the most valuable insights to leadership.
By mastering these financial modeling skills, you’ll establish yourself as an indispensable FP&A professional who delivers the structured analysis business leaders rely on.
Ready to master financial modeling to excel in FP&A? Take your modeling skills to the next level with CFI’s FP&A Specialization. This comprehensive program prepares you to support business leaders with top-tier financial models, budgets, forecasts, and analysis techniques used by finance teams at Amazon, JPMorgan, and PwC.
Excel Model Design for FP&A Professionals
5 Headcount Forecasting Errors and How to Fix Them
Four Forecasting Models Compared (And When You Should Use Each)


