Get Certified for
Capital Markets (CMSA®)
From equities and fixed income to derivatives, the CMSA certification bridges the gap from where you are now to where you want to be — a world-class capital markets analyst.
The portion of community income given from the richer population to the poorer half to achieve an equal wealth distribution
The Hoover Index is one of the simplest inequality metrics that are used to measure the deviation from the preferred equal distribution. The index is equal to the portion of community income that would be taken from the richer half of the population and given to the other poorer half of the population for a society to be perfectly equal.
In a perfectly equal society, there would be no need to redistribute income in order to achieve an equal wealth distribution. The Hoover Index is also known as the Robin Hood Index or the Schutz Index.

In an economy where the majority of the wealth is concentrated in the hands of a few individuals, the majority of that income would require being redistributed (taken from the richer) – given to the majority of the population that is poor – in order to achieve income equality.
Generally, the Hoover Index varies from 0 to 1 (or 0 to 100%), where 0 represents a perfectly equal society and 100 represents a society with maximum inequality.
Sociologists use income inequality metrics to measure the income inequalities among the participants in a national or global economy. Classical economists such as David Ricardo and Adam Smith were concerned with the distribution of factor income, which is the distribution of the main factors of production such as land, capital, and labor.
Like the classical economists, modern economists have also discussed the topic of income redistribution in the economy, but with a focus on individuals and household units.
An income inequality metric should have the following properties:
An income inequality metric should not be based on the assumption that the economy has a large population or a small population. It means that the inequality metric should not rely on the size of the population.
Therefore, an economy with only a small population should not be viewed as more equal than an economy that has a large population.
Also known as Pigou-Dalton, this principle requires that if income is transferred from the rich and given to a poor person, the measured level of inequality should not increase. Rather, the inequality should decrease since there has been an action to reduce to reduce the inequality and move toward a perfectly equal society.
This assumption states that the metric should not depend on the specific individuals in the economy but on the distribution of income.
For example, if an economy has two people, Person A and B, and they hold 70% and 30% of the wealth, respectively, the inequality metric should be same regardless of whether it is Person A or B who has 30%. Therefore, the metric should not depend on who the particular people in the economy are, but how the income is distributed.
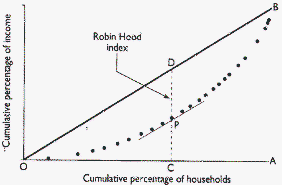
On a graph, the Hoover Index is equivalent to the longest vertical distance between the Lorenz Curve and the 45-degree line representing the perfect equality line. The value of the Hoover index shows an estimate of the share of the total community income that needs to be transferred from the households that are above the mean to the households that are ranked below the mean in order to achieve equality in income distribution.
The relationship can be graphically represented on a graph as follows:
The Theil Index is a statistic that is used to measure economic equality as well as isolation, redundancy, non-randomness, and compressibility. It was first proposed by Henri Theil, an econometrician at the Erasmus University Rotterdam.
The index shows the distributional redundancy through which participants in the economy are awarded incomes in a stochastic process. On the other hand, the Hoover Index shows the minimum share of income that would have to be shared among the participants in order to reach the maximum entropy.
When the Hoover Index is applied to allocation processes in the real world, it does not mean that these processes occur in a perfectly planned economy. Rather, the index yields the distance between resource distribution to poorer participants in the current system and the final process of distributing resources to achieve perfect income equality.
Similarly, when the Theil index is applied in the allocation of resources, it does not mean that it follows a stochastic process. Instead, the index yields the distance between resource distribution to poorer participants in the current system to the final stage of equalizing resource distribution.
CFI is the official provider of the Capital Markets & Securities Analyst (CMSA®) certification program, designed to transform anyone into a world-class financial analyst.
To keep learning and developing your knowledge of financial analysis, we highly recommend the additional CFI resources below:


