Get Certified for
Capital Markets (CMSA®)
From equities and fixed income to derivatives, the CMSA certification bridges the gap from where you are now to where you want to be — a world-class capital markets analyst.
A measure of a security's sensitivity to movements in the overall market
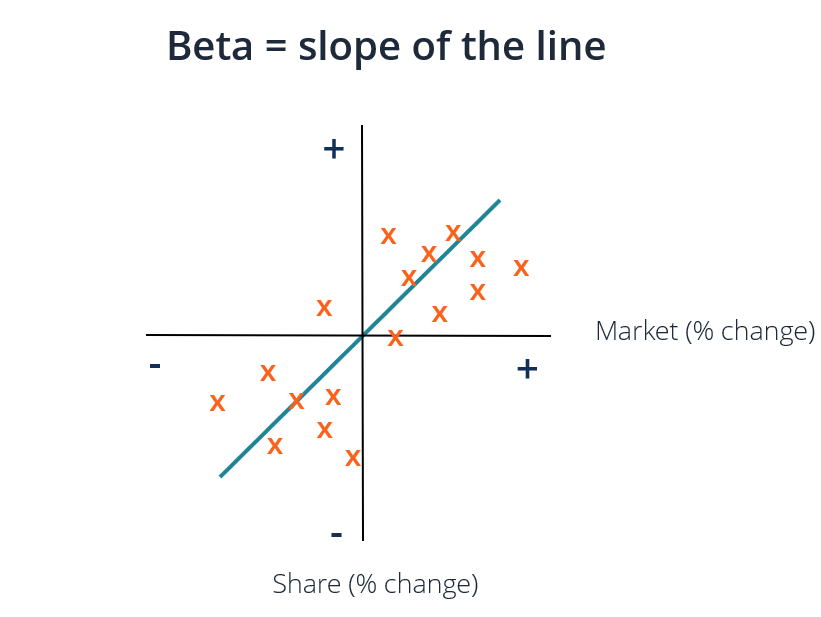
The Beta coefficient is a measure of the sensitivity or correlation of a security or an investment portfolio to movements in the overall market. We can derive a statistical measure of risk by comparing the returns of an individual security/portfolio to the returns of the overall market and identifying the proportion of risk that can be attributed to the market.
Systematic risk is the underlying risk that affects the entire market. Large changes in macroeconomic variables, such as interest rates, inflation, GDP, or foreign exchange, affect the broader market. The Beta coefficient relates “general-market” systematic risk to “stock-specific” unsystematic risk by comparing the rate of change between “general-market” and “stock-specific” returns.
We can think about unsystematic risk as “stock-specific” risk and systematic risk as “general-market” risk. If we hold only one stock in a portfolio, the return of that stock may vary wildly compared to the average gain or loss of the overall market, as reflected by a major stock index such as the S&P 500.
However, as we diversify investments by adding different securities to a portfolio, the portfolio’s returns will gradually resemble the overall market’s returns. As we diversify our stock portfolio, the “stock-specific” unsystematic risk is reduced.
The Capital Asset Pricing Model (CAPM) describes individual stock returns as a function of the overall market’s returns.
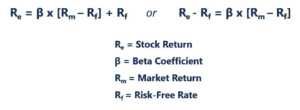
Each of these variables can be thought of using the slope-intercept framework where Re = y, B = slope, (Rm – Rf) = x, and Rf = y-intercept. Important insights to be gained from this framework are:
In the graph above, we plotted excess stock returns over excess market returns to find the line of best fit. However, we observe that this stock has a positive intercept value after accounting for the risk-free rate. This value represents Alpha, or the additional return expected from the stock when the market return is zero.
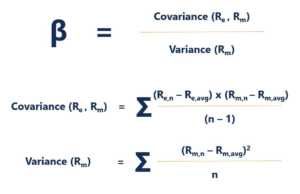
To calculate the Beta of a stock or portfolio, divide the covariance of the excess asset returns and excess market returns by the variance of the excess market returns over the risk-free rate of return:
One of the most popular uses of Beta is to estimate the cost of equity (Re) in valuation models. The CAPM estimates an asset’s Beta based on a single factor, which is the systematic risk of the market. The cost of equity derived by the CAPM reflects a reality in which most investors have diversified portfolios from which unsystematic risk has been successfully diversified away.
In general, the CAPM and Beta provide an easy-to-use calculation method that standardizes a risk measure across many companies with varied capital structures and fundamentals.
The largest drawback of using Beta is that it relies solely on past returns and does not account for new information that may impact returns in the future. Furthermore, as more return data is gathered over time, the measure of Beta changes, and subsequently, so does the cost of equity.
While systematic risk inherent to the market has a meaningful impact in explaining asset returns, it ignores the unsystematic risk factors that are specific to the firm. Eugene Fama and Kenneth French added a size factor and value factor to the CAPM, using firm-specific fundamentals to better describe stock returns. This risk measure is known as the Fama French 3 Factor Model.
Connect what you just learned to a clear career path with CFI’s role‑based courses and certification programs.
Thank you for reading CFI’s guide on Beta Coefficient. To keep learning and advance your career, the following resources will be helpful:


