Get Certified for
Financial Planning & Wealth Management Professional (FPWMP®)
Learn financial analysis & planning, portfolio management, and risk assessment.
An adjustment for seasonal variations that occur through the corresponding data period
The seasonally adjusted annual rate (SAAR) is an adjustment made to financial and economic data to take into account seasonal variations that occur through a period and is expressed as an annual total.

Seasonal variations in data are a very common occurrence. This is because, during a data period, there are cyclical boom and bust periods because of social, political, and economic conditions that create volatility and periodic changes in demand. Hence, data is directly and indirectly affected by such volatility and must be smoothed or compensated for when it is analyzed.
It is why a seasonally adjusted annual rate is so important. It takes into account the seasonal variations that occurred through the corresponding data period and adjusts the data accordingly, thereby removing the effect of seasonality and making the data more reliable and accurate.
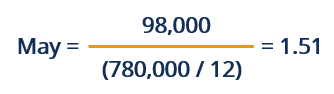
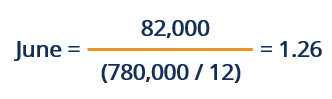
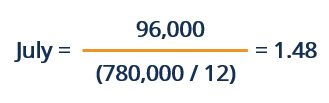
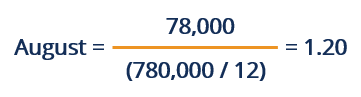
An important measure called the “seasonal factor” is used to calculate the SAAR. The seasonal factor is calculated by taking the unadjusted data (monthly or quarterly) and dividing it by the annual average number (monthly or quarterly).
Say, for example, PepsiCo produced 780,000 bottles of Pepsi in a year. The company’s total production in May was 98,000, in June was 82,000, in July was 96,000, and in August was 78,000.
Therefore, the seasonal factor for PepsiCo for the months of:
The SAAR is calculated by taking the unadjusted monthly (or quarterly) estimates and dividing by the corresponding seasonality factor, and multiplied by 12 (or 4, if quarterly).
The SAAR is important because of the following reasons:
The SAAR is an important data measure because it accounts for seasonal fluctuations occurring throughout the data period. It is important to account for seasonal variations when trying to extrapolate individual data points to predict annual results, because they may not show the true picture; individual months results may be affected by the boom or bust of seasonality and SAAR removes these effects.
By taking into account the seasonal variations and adjusting data accordingly, the SAAR makes the data available more reliable and more accurate – one that provides a true financial and/or economic picture.
The SAAR is also very important because it helps make data comparisons much easier. It is difficult to compare raw data between different time periods or between different businesses when it is unadjusted. As the data groups may be affected by cyclical trends differently and a direct comparison is not apples to apples.
Adjusting the data and eliminating seasonal variations makes comparisons between different periods and between different companies much easier and helps draw accurate and reliable conclusions.
By removing the seasonal impact on business data, the SAAR helps make informed business decisions. It helps in the decision-making process by providing a clearer financial picture – one that is not inflated or deflated by data seasonality.
Some real-life examples of business data seasonality include:
To keep learning and developing your knowledge of financial analysis, we highly recommend the additional resources below:


