Get Certified for
Capital Markets (CMSA®)
From equities and fixed income to derivatives, the CMSA certification bridges the gap from where you are now to where you want to be — a world-class capital markets analyst.
A graph of yields over time
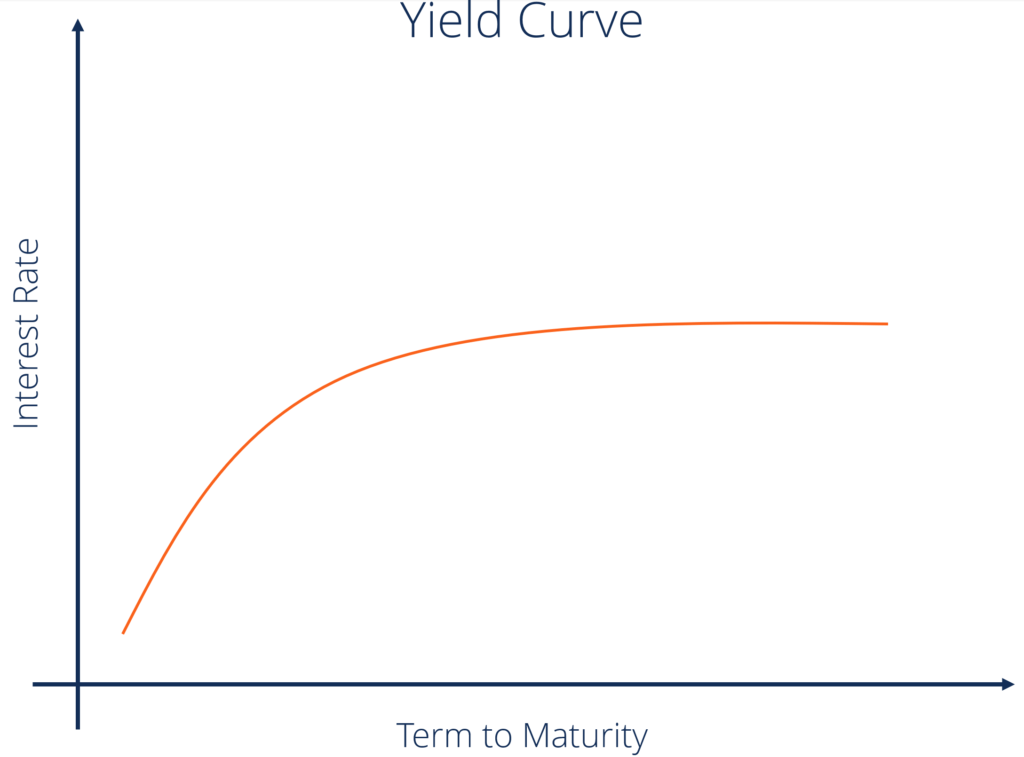
The Yield Curve is a graphical representation of the interest rates on debt for a range of maturities. It shows the yield an investor is expecting to earn if he lends his money for a given period of time. The graph displays a bond’s yield on the vertical axis and the time to maturity across the horizontal axis. The curve may take different shapes at different points in the economic cycle, but it is typically upward sloping.
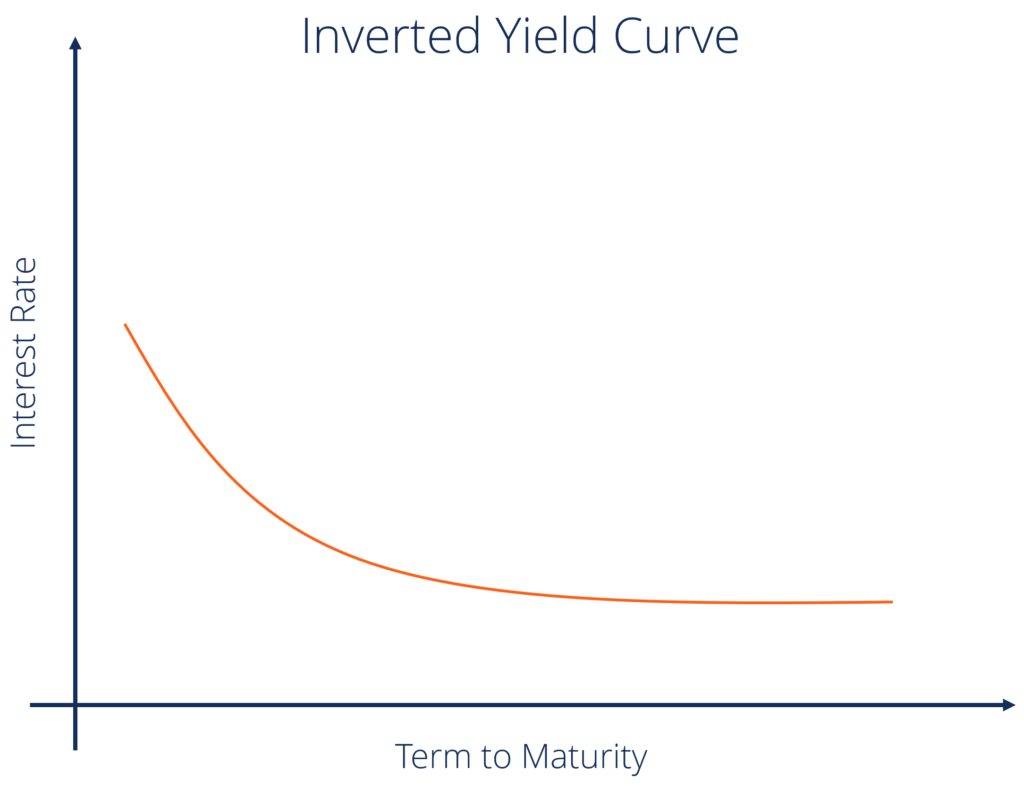
A fixed income Analyst may use the yield curve as a leading economic indicator, especially when it shifts to an inverted shape, which signals an economic downturn, as long-term returns are lower than short-term returns.
Learn more about bonds in CFI’s Fixed Income Fundamentals Course!
This is the most common shape for the curve and, therefore, is referred to as the normal curve. The normal yield curve reflects higher interest rates for 30-year bonds as opposed to 10-year bonds. If you think about it intuitively, if you are lending your money for a longer period of time, you expect to earn a higher compensation for that.

The positively sloped yield curve is called normal because a rational market will generally want more compensation for greater risk. Thus, as long-term securities are exposed to greater risk, the yield on such securities will be greater than that offered for lower-risk short-term securities.
A longer period of time increases the probability of unexpected negative events taking place. Therefore, a long-term maturity will typically offer higher interest rates and have higher volatility.
An inverted curve appears when long-term yields fall below short-term yields. An inverted yield curve occurs due to the perception of long-term investors that interest rates will decline in the future. This can happen for a number of reasons, but one of the main reasons is the expectation of a decline in inflation.
When the yield curve starts to shift toward an inverted shape, it is perceived as a leading indicator of an economic downturn. Such interest rate changes have historically reflected the market sentiment and expectations of the economy.
A steep curve indicates that long-term yields are rising at a faster rate than short-term yields. Steep yield curves have historically indicated the start of an expansionary economic period. Both the normal and steep curves are based on the same general market conditions. The only difference is that a steeper curve reflects a larger difference between short-term and long-term return expectations.

Learn more in CFI’s Fixed Income Fundamentals Course!
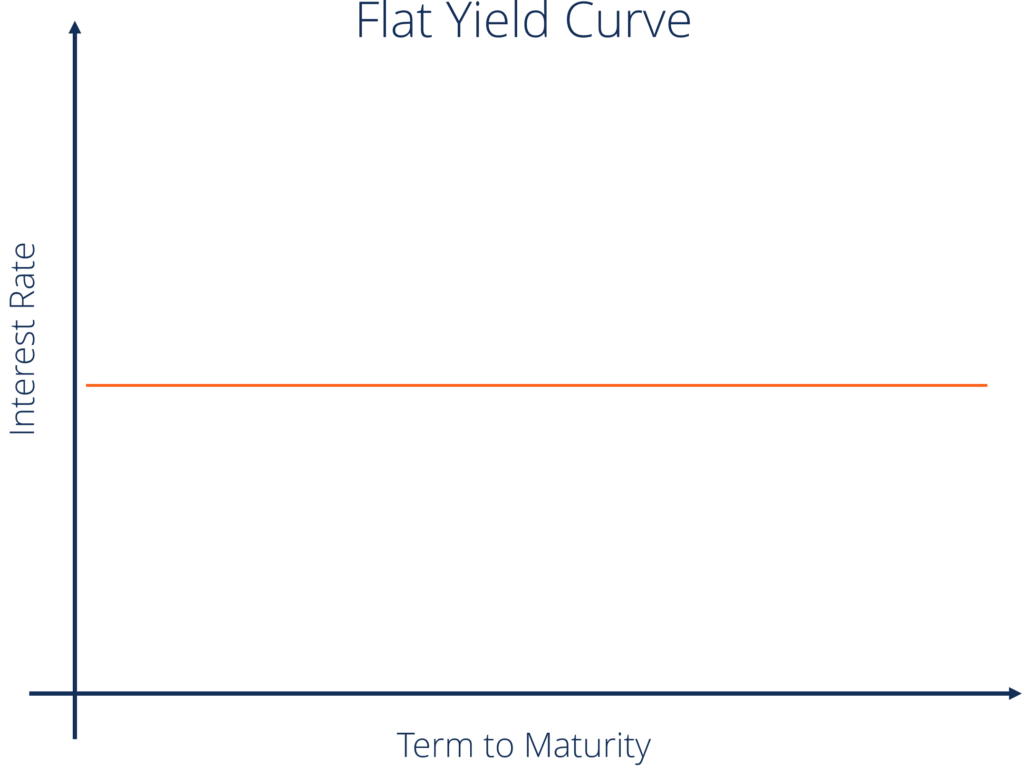
A flat curve happens when all maturities have similar yields. This means that the yield of a 10-year bond is essentially the same as that of a 30-year bond. A flattening of the yield curve usually occurs when there is a transition between the normal yield curve and the inverted yield curve.
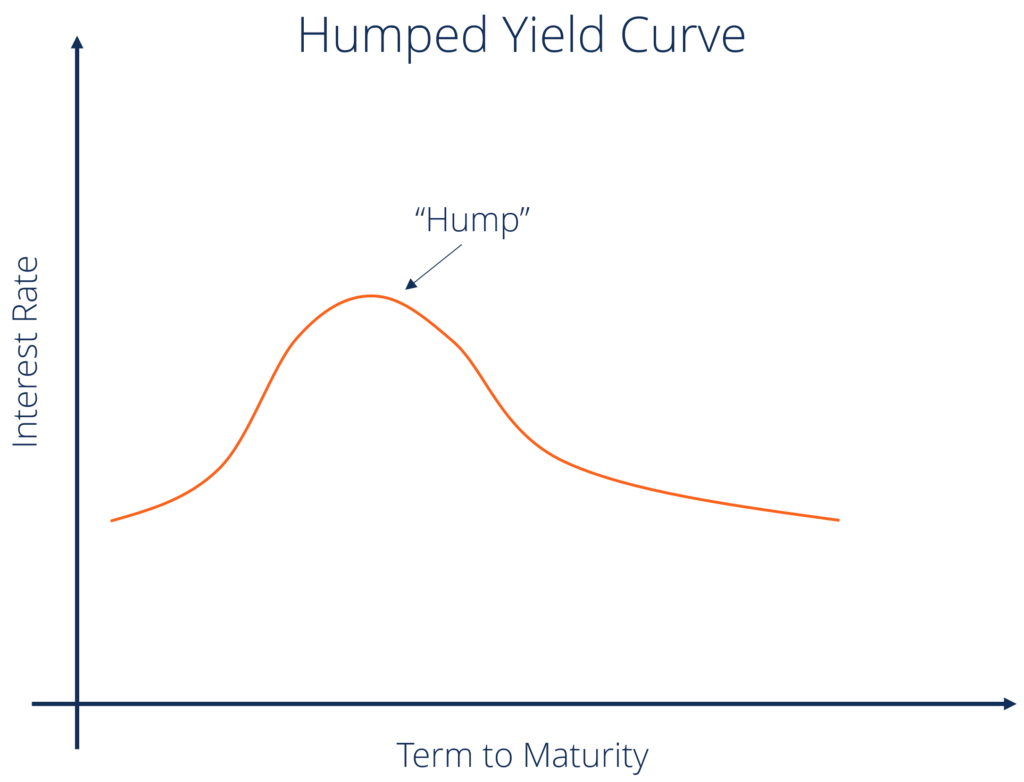
A humped yield curve occurs when medium-term yields are greater than both short-term yields and long-term yields. A humped curve is rare and typically indicates a slowing of economic growth.
Central banks tend to respond to a rise in expected inflation with an increase in interest rates. A rise in inflation leads to a decrease in purchasing power and, therefore, investors expect an increase in the short-term interest rate.
Strong economic growth may lead to an increase in inflation due to a rise in aggregate demand. Strong economic growth also means that there is a competition for capital, with more options to invest available for investors. Thus, strong economic growth leads to an increase in yields and a steeper curve.
If the central bank raises the interest rate on Treasuries, this increase will result in higher demand for treasuries and, thus, eventually lead to a decrease in interest rates.
The shape of the curve helps investors get a sense of the likely future course of interest rates. A normal upward-sloping curve means that long-term securities have a higher yield, whereas an inverted curve shows short-term securities have a higher yield.
Banks and other financial intermediaries borrow most of their funds by selling short-term deposits and lend by using long-term loans. The steeper the upward sloping curve is, the wider the difference between lending and borrowing rates, and the higher is their profit. A flat or downward sloping curve, on the other hand, typically translates to a decrease in the profits of financial intermediaries.
The yield curve helps indicate the tradeoff between maturity and yield. If the yield curve is upward sloping, then to increase his yield, the investor must invest in longer-term securities, which will mean more risk.
The curve can indicate for investors whether a security is temporarily overpriced or underpriced. If a security’s rate of return lies above the yield curve, this indicates that the security is underpriced; if the rate of return lies below the yield curve, then it means that the security is overpriced.
Learn more in CFI’s Fixed Income Fundamentals Course!
This theory assumes that the various maturities are substitutes and the shape of the yield curve depends on the market’s expectation of future interest rates. According to this theory, yields tend to change over time, but the theory fails to define the details of yield curve shapes. This theory ignores interest rate risk and reinvestment risk.
This theory is an extension of the Pure Expectation Theory. It adds a premium called liquidity premium or term premium. This theory considers the greater risk involved in holding long-term debts over short-term debts.
The segmented markets theory is based on the separate demand and supply relationship between short-term securities and long-term securities. It is based on the fact that different maturities of securities cannot be substituted for one another.
Since investors will generally prefer short-term maturity securities over long-term maturity securities because the former offers lower risk, then the price of short-term securities will be higher, and thus, the yield will be correspondingly lower.
This is an extension of the Market Segmentation Theory. According to this theory, investors prefer a certain investment horizon. To invest outside this horizon, they will require some premium. This theory explains the reason behind long-term yields being greater than short-term yields.
Thank you for reading CFI’s guide on Yield Curve. Here are other CFI resources that you might find interesting:


