Get Certified for
Business Intelligence (BIDA®)
Develop analytical superpowers by learning how to use programming and data analytics tools such as VBA, Python, Tableau, Power BI, Power Query, and more.
A schematic representation of the elements in a set or a group
A Venn diagram is a schematic representation of the elements in a set or a group. It is a diagram that shows all the possible logical relationships between a finite assemblage of sets or groups. It is also referred to as a set diagram or logic diagram.
A Venn diagram uses multiple overlapping shapes (usually circles) representing sets of various elements. It aims to provide a graphical visualization of elements, highlighting the similarities and differences between them.
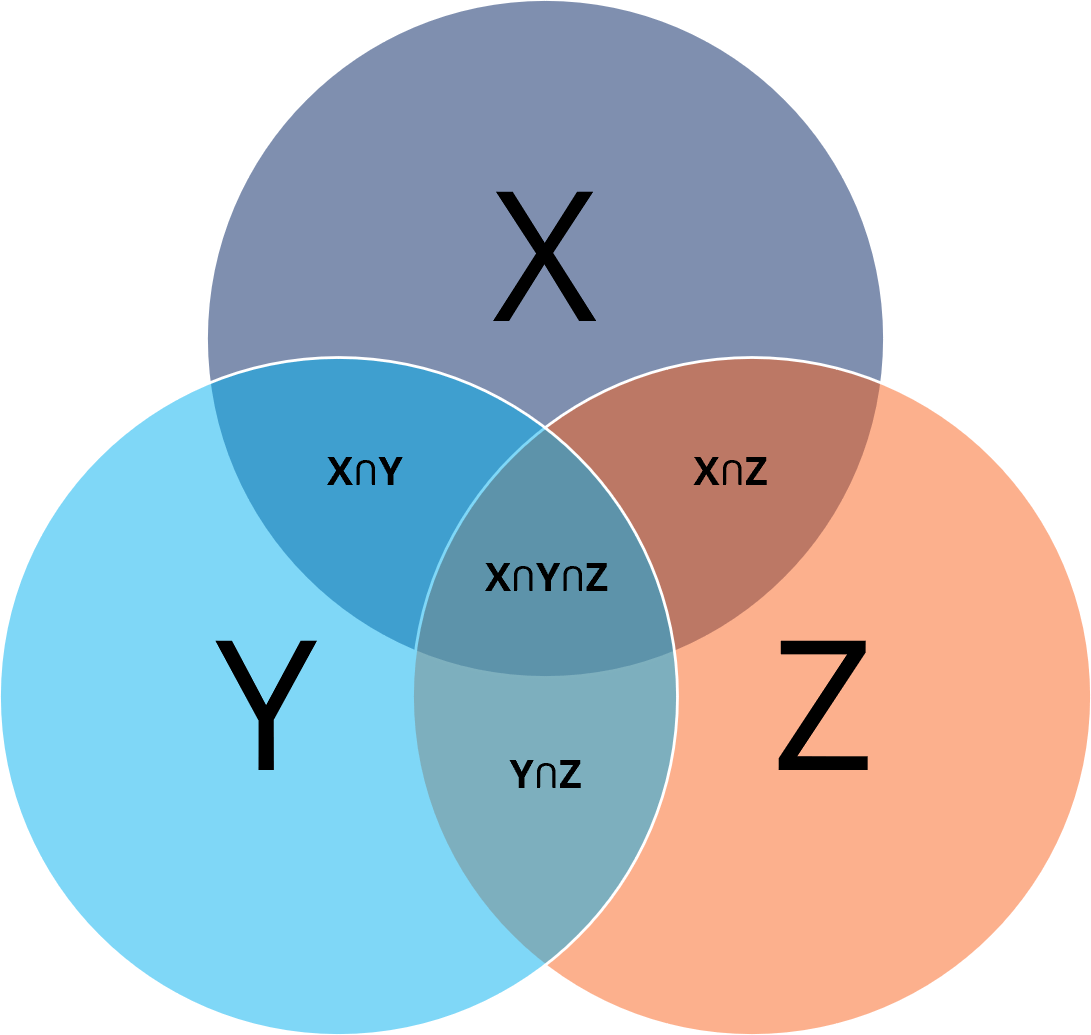
They are mainly used in set theory and also to illustrate relationships between elements in various areas, such as statistics, logic, probability, linguistics, business, and computer science. An example of a Venn diagram above shows three sets labeled X, Y, and Z and the corresponding relationships between elements in each set.
Venn diagrams provide a powerful visual display of data, commonly used in presentations and business and scientific reports. They are related to Euler diagrams, which only differ in that they do not illustrate a set if there are no elements present.
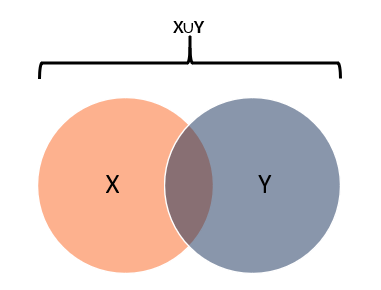
Union (∪): Represents the union of all sets – i.e., the universe of all elements within X and Y sets.
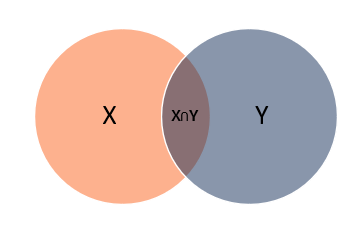
Intersection (∩): Represents all elements shared or common within the selected sets or groupings. Intersection represents shared elements (in the middle) within sets X and Y.
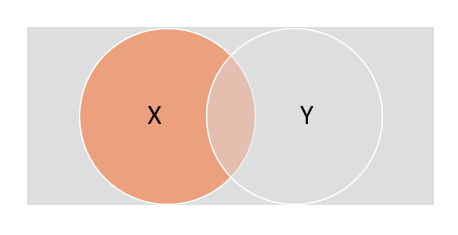
Complement (XC): Represents whatever is not represented in a particular set; in this case, everything not in set X. An equation to illustrate the complement of X is XC = U/A, where U represents a given universe of elements. The diagram below shows the absolute complement of X in U – i.e., everything in the universe except for X (grey area).
The Venn diagram concept was established by British mathematician and logician John Venn. It was first published in his 1980 journal titled “On the Diagrammatic and Mechanical Representation of Propositions and Reasonings.” However, the development of Venn diagrams can be traced back to the 1200s through philosopher and logician Ramon Llull, who drew similar types of diagrams.
There are various other logicians who also drew similar diagrams, but the closest diagrams that resemble Venn diagrams were first drawn by Leonard Euler in the 1700s. He drew what he defined as Euler diagrams. John Venn referenced Euler in his diagrams, which he first described as Euler circles.
The term Venn diagram was first published by Clarence Irvine Lewis in his 1918 book, “A Survey of Symbolic Logic.” Mathematicians and logicians continued to improve the diagrams in the 19th and 20th centuries to show clearer and more complex relationships using more sets. Venn diagrams were adopted in various disciplines and complexities aided by evolving technology and the use of computers.
As highlighted above, Venn diagrams are used in several ways to show relationships between various set elements. Below are examples of uses of Venn diagrams.
A study is being done at a school on students who take the subjects mathematics and economics. There are 12 students who attend both classes and 2 students who do not take either of the subjects.
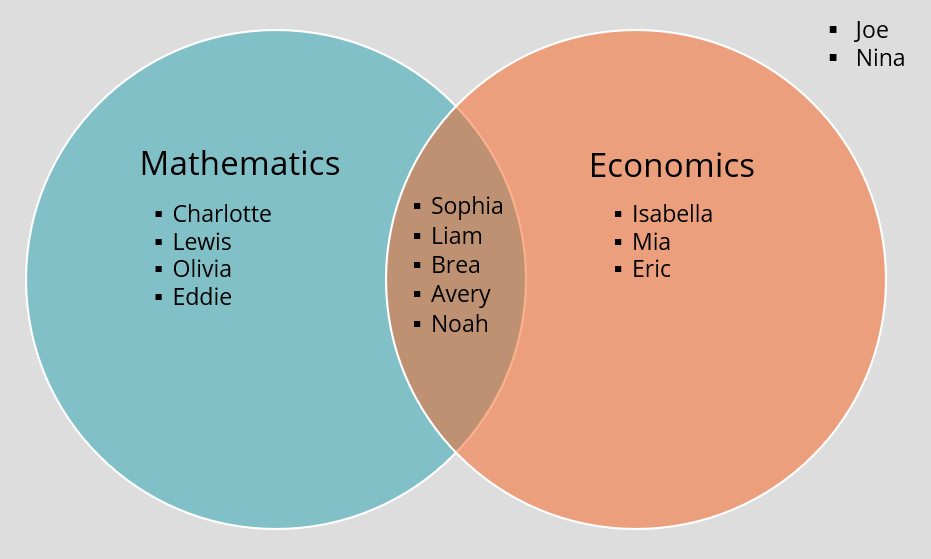
Mathematics ∪ Economics: {Charlotte, Lewis, Olivia, Eddie, Sophia, Liam, Brea, Avery, Noah, Isabella, Mia, Eric}. The illustration is below:
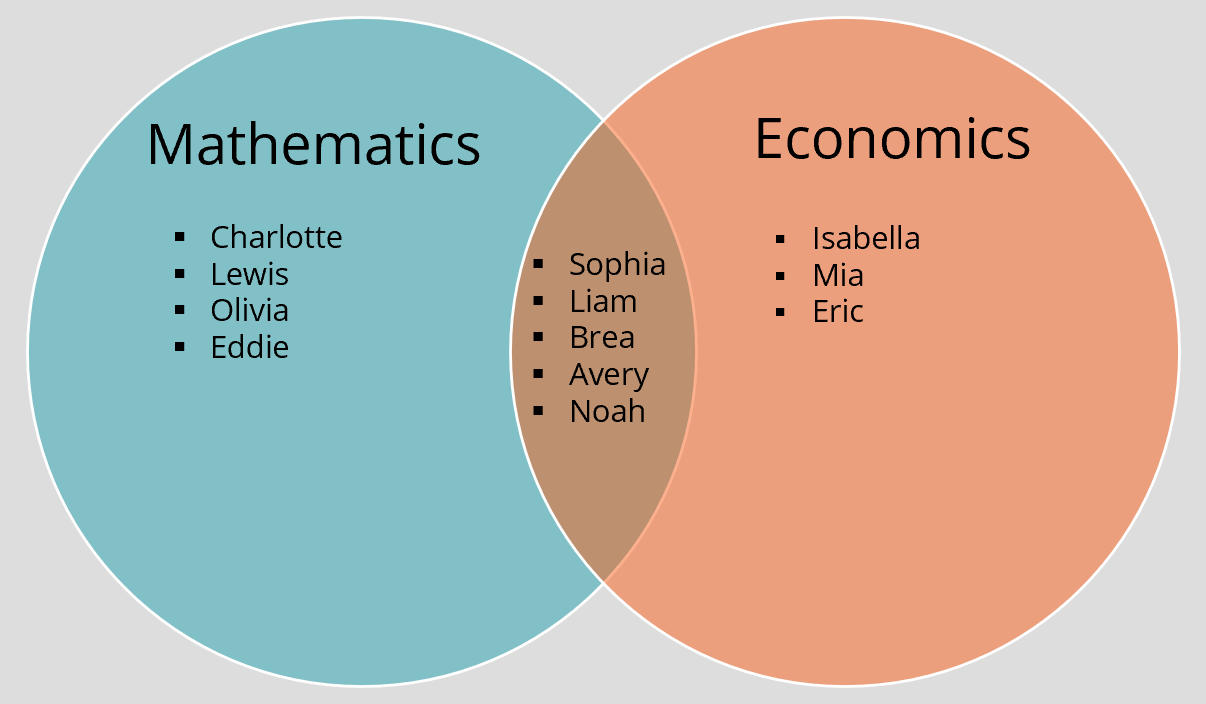
The union of the two subjects is the universe of all students who take both classes – i.e., 12 students.
Mathematics ∩ Economics: {Sophia, Liam, Brea, Avery, Noah}
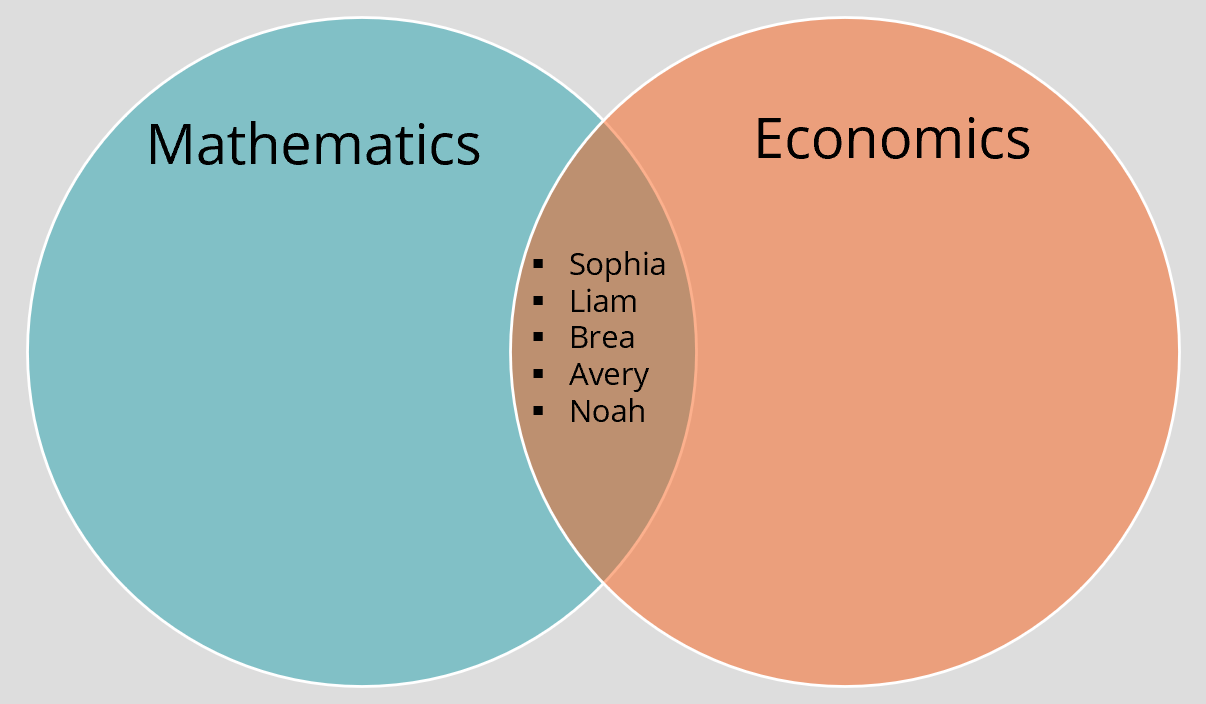
The above shows the intersection of students who take mathematics and economics. These are students who take both subjects but do not take only one of the subjects.
MathematicsC: {Isabella, Mia, Eric, Joe, Nina}
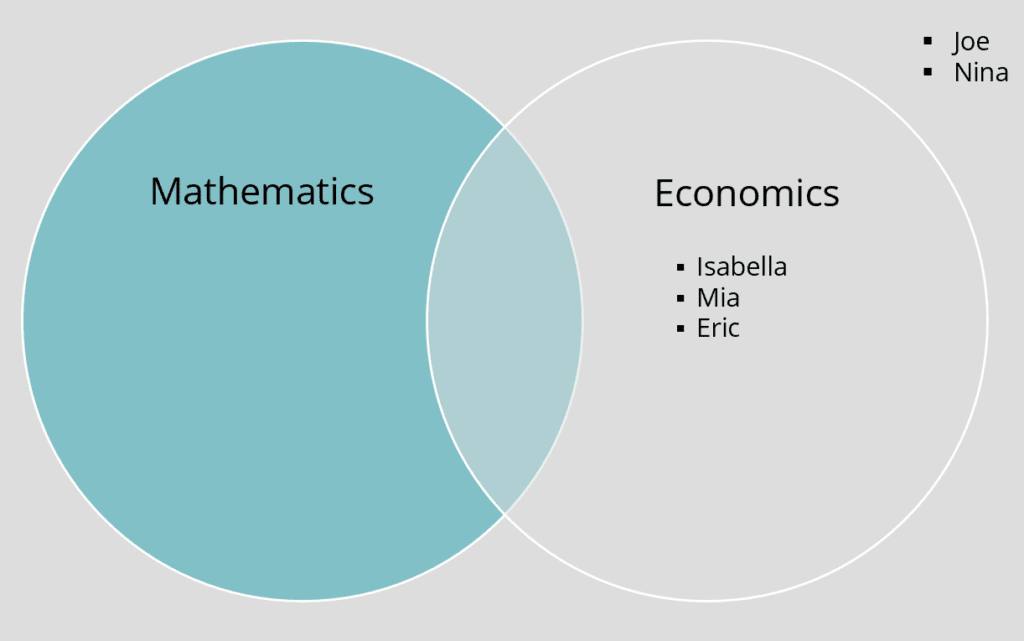
The complement of mathematics represents all students that do not take mathematics. These include students who take economics but not mathematics, and students who do not take either subject (grey area).
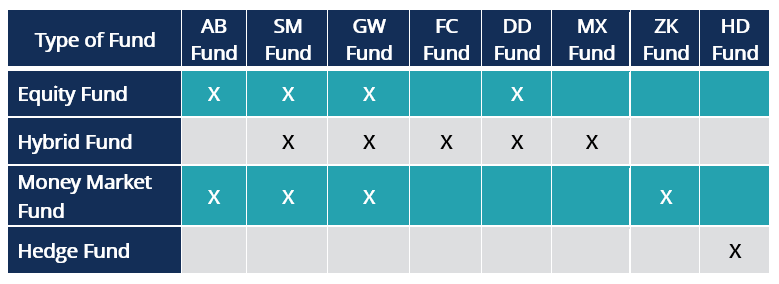
The table above compares eight investment funds in terms of the types of funds that each fund operates. There are different types of funds under consideration, notably equity fund, money market fund, hybrid fund (i.e., a mixture of equity and money market instruments), and a hedge fund. The eight investment funds operate one or more of these fund types.
Through distinct color-coding, the Venn diagram clearly shows where each fund lies. A few observations on the above chart are discussed below:
Equity Fund ∪ Hybrid Fund ∪ Money Market Fund: {AB Fund, SM Fund, GW Fund, ZK Fund, FC Fund, MX Fund, DD Fund}
Equity Fund ∩ Money Market Fund ∩ Hybrid Fund
Equity Fund ∩ Money Market Fund
Equity Fund ∩ Hybrid Fund
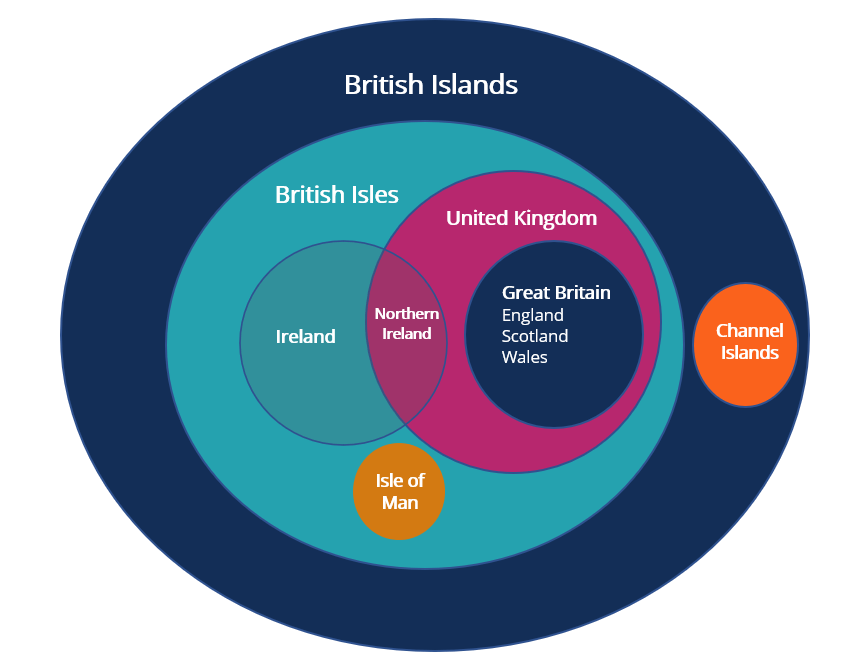
Venn diagrams do not just show overlaps but can also show subsets within a larger set or group. We illustrate below the British Islands, clearly showing the subsets of each island within the larger set.
A Venn diagram can be created in several ways. Below are various tools used to construct Venn diagrams:
Connect what you just learned to a clear career path with CFI’s role‑based courses and certification programs.
Thank you for reading CFI’s guide to Venn Diagrams. To keep learning and developing your knowledge base, please explore the additional relevant resources below:


