Get Certified for
Business Intelligence (BIDA®)
Develop analytical superpowers by learning how to use programming and data analytics tools such as VBA, Python, Tableau, Power BI, Power Query, and more.
The range of potential returns an investment yields based on their risk
Dispersion is a term that describes the spread of values against a specific variable. Dispersion can be measured through:

Within the realm of finance, dispersion is used to determine the potential returns on an investment, as well as the inherent risk of a portfolio of investments. Thus, it is a tool used to measure uncertainty.
Upon the countless securities to invest in, many factors are evaluated and considered. One example is the inherent risk that an investment yields. Dispersion can measure that risk and provide investors with a clearer perspective on which investments may appear to be appealing.
The dispersion of an asset’s return will show the volatility and risk of adding that asset within an individual’s portfolio. The greater the range of returns on the asset, the riskier and more volatile it is as a whole.
For example, if an asset yields a historical return that can range from +15% to -20%, that would be much more volatile relative to a different asset that may yield a smaller range of historical returns, such as +5% to -5%.
Alpha is a measure used by portfolio managers to determine whether the investment or portfolio’s risk-adjusted returns are outpacing the market. It evaluates the performance of an investment against a market index by comparing the excess return of the investment to the benchmark index’s returns. A positive alpha indicates that the trading strategy or portfolio is indeed outperforming the market, while a negative alpha implies otherwise.
The primary and most renowned statistical measure for risk is beta, which measures the volatility of an asset’s returns relative to the entire market or index.
Beta can be the following:
A beta of 1 indicates that the asset’s returns and volatility are in unison with the market. However, a beta greater than 1 indicates that the asset would likely outperform the market but is also more volatile. For example, if the market is up 10%, but the beta of the asset is 1.5, the asset may be up by 15%.
On the other hand, it is important to be aware that if the market goes down, the asset with the beta that is greater than 1 will likely yield even lower returns than the market. Thus, beta amplifies returns.
A beta that is less than 1 implies that the asset is less risky than the market. It also indicates that the asset trails the market rather than outperforming it. For example, if the beta is 0.5 and the market is up 10%, the asset would likely provide a 5% return.
The capital asset pricing model (CAPM) identifies the required return of an investment and is an equation that integrates both beta and alpha. As the CAPM formula assumes that the portfolio being evaluated is already diversified, it focuses solely on systematic (market) risk to determine expected portfolio returns. The original equation is defined as follows:

Where:
Rp = Realized return
Rf = Risk-free rate
Rm = Market return
The rearranged formula to calculate alpha is as follows:
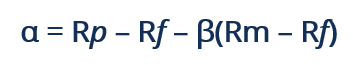
In such a case, alpha is determined by the difference between the realized return of the portfolio and the expected market return of the portfolio (required return).
CFI offers the Business Intelligence & Data Analyst (BIDA®) certification program for those looking to take their careers to the next level. To keep learning and advancing your career, the following resources will be helpful:


