Get Certified for
Capital Markets (CMSA®)
From equities and fixed income to derivatives, the CMSA certification bridges the gap from where you are now to where you want to be — a world-class capital markets analyst.
An investment strategy that aims to benefit from the favorable pricing trends of securities
Momentum investing is an investment strategy aimed at purchasing securities that have been showing an upward price trend or short-selling securities that have been showing a downward trend. The main rationale behind momentum investing is that once a trend is well-established, it likely to continue.

There is no consensus among economists and finance professionals regarding the validity of a momentum investing strategy. Economists try to explain the effects of momentum investing using the efficient-market theory.
One hypothesis states that investors bear a significant risk when implementing a momentum investing strategy. Potentially high returns are the reward that counterbalances that risk. Another hypothesis suggests that momentum investors are leveraging the behavioral weaknesses of other investors, such as the tendency to “follow the herd”, also known as the “herd mentality bias”.
Momentum investing is strictly a technical trading strategy. Unlike fundamental or value investors, momentum investors are not concerned with a company’s operational performance. Momentum investors apply technical indicators to the analysis of a security in order to identify trends and gauge the strength of the trend – in other words, to determine the level of price momentum in the market.
Momentum investors also seek to analyze, understand, and, if possible, anticipate the behavior of other investors in the market. Awareness of behavioral biases and investor emotions can significantly enhance the effectiveness of a momentum investing strategy.
Technical analysis is the primary point of reference for momentum investors. Since traders spend a significant amount of time trying to determine the strength of trends in asset prices, knowledge of key technical indicators is crucial to the successful execution of a momentum trading strategy.
Following are some of the technical indicators that are most commonly used in momentum trading:
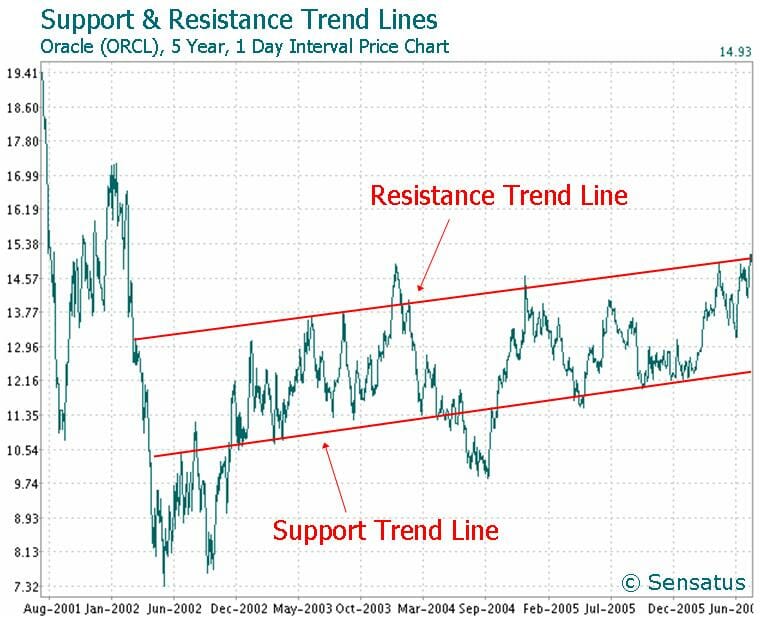
Trend lines are a basic technical analysis tool for monitoring price movements. A trend line is drawn between two successive points on a price chart. If the resulting line is sloping upward, then it indicates that there is a positive, bullish trend, and an investor may buy shares. If the resulting line is downsloping, then the trend is negative, or bearish, and selling short is indicated as the most likely profitable position to adopt.
A moving average line enables traders to identify the prevailing trend while eliminating much of the market “noise” that comes from small, insignificant price fluctuations. When a security’s price consistently remains at or above a moving average, that indicates the existence of an uptrend. A downtrend is usually reflected on a chart by price maintaining a position at or below a chosen moving average.
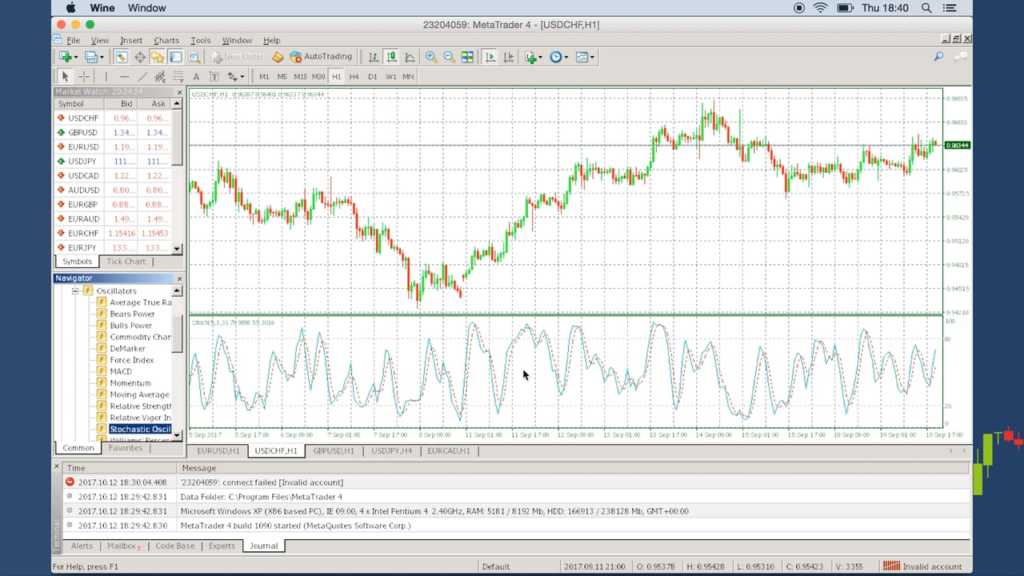
The stochastic oscillator compares an asset’s most recent closing price to the prices over a specified period of time. When the closing price is near the high of the price range for the time period, the trend is positive. When the closing price is near the low, this indicates a downward trend.
Stochastic oscillator values range from 0 to 100. Higher numbers above 50 indicate a strengthening uptrend. Lower numbers, below 50, indicate a downtrend that is gaining momentum. However, an oscillator reading below 20 indicates oversold conditions in a market that may lead to a market reversal to the upside. Likewise, readings above 80 indicate overbought conditions and the potential for a bearish reversal.
The Average Directional Index (ADX) is a very popular momentum indicator and one that is generally considered less prone to producing false signals than the stochastic oscillator. The ADX is used to determine (A) the existence of a trend and (B) the strength of a trend. It does this by calculating the expansion (or contraction) of a security’s price range over a specified time period.
ADX values range from 0 to 100. Values below 25 (some traders use 20 rather than 25) indicate a ranging, or directionless, market in which no clear trend exists. A reading above 25 indicates the existence of a trend, and higher readings beyond that level indicate a stronger trend. In other words, an ADX reading of 40 indicates a stronger trend than an ADX reading of 30.
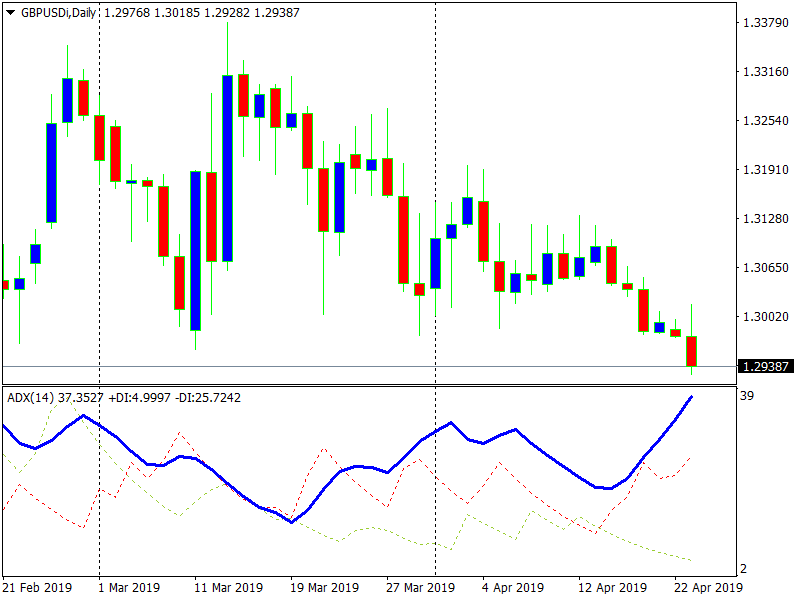
Traders also look for divergence between price movement and the ADX as a sign of waning or weakening momentum. If price makes a new high but the ADX does not reach a new high reading, that is bearish divergence of the ADX from price. On the other end of the scale, if price falls to a new low but the ADX does not see a new low reading, that represents a bullish divergence of the ADX from price.
Other popular momentum investing indicators include the Moving Average Convergence Divergence (MACD) indicator and the Relative Strength Index (RSI).
Traders employing a momentum investing strategy look to profit from either buying or selling short securities when they are strongly trending – i.e., when price action momentum is high. High momentum is evidenced by price advancing or declining over a wide range in a relatively short period of time. Markets with high levels of momentum typically show increased volatility as well.
Momentum investing is typically short-term investing, as traders are merely looking to capture part of the price movement in a trend. A momentum investing trade unfolds as follows:
Thank you for reading CFI’s guide on Momentum Investing. To learn more, check out the free resources below:


