Get Certified for
Capital Markets (CMSA®)
From equities and fixed income to derivatives, the CMSA certification bridges the gap from where you are now to where you want to be — a world-class capital markets analyst.
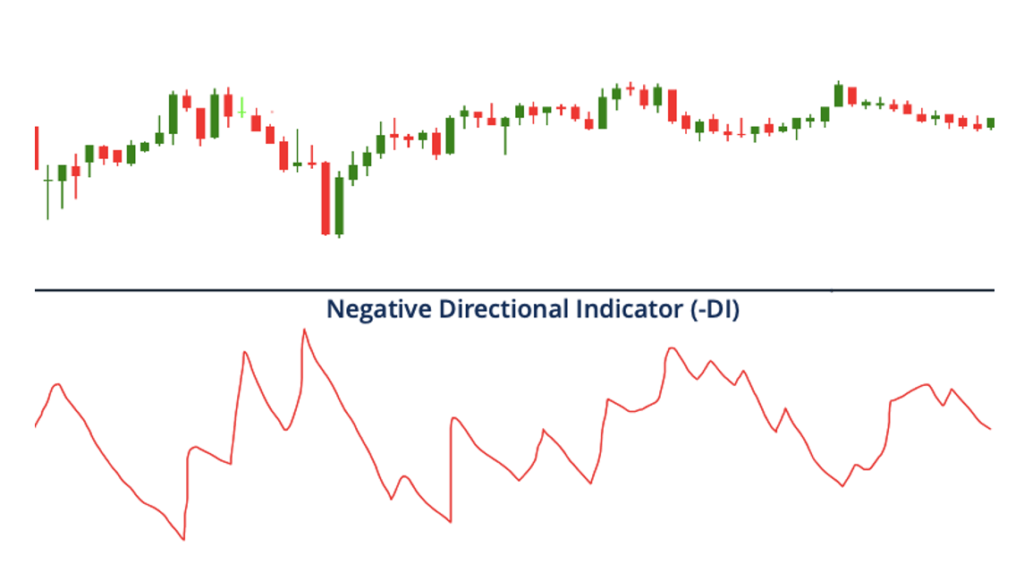
Represents the downward behavior of the financial market
A negative directional indicator (-DI) represents the downward behavior of the financial market. An upward sloping negative directional indicator indicates that the downtrend is strengthening. Theoretically, a (-DI) occurs when the difference in the low price of a security for two consecutive periods exceeds the difference in the high price of the security over the same periods. The negative directional indicator is generally plotted in combination with the positive directional indicator (+DI).
The negative directional indicator is used along with the positive directional indicator to show the price trend movement. The two lines are components of the Average Directional Index (ADX) page. ADX is the smoothed average of both directional indicators and plotted along with the directional indicators.
If the +DI is above the -DI, the price movement is upward and vice-versa. When the strength of the recent upward behavior (i.e., positive directional indicator) is greater than the strength of the recent downward movement (i.e., negative directional indicator), it indicates a buy or long position. Similarly, if the strength of the recent downward movement is greater than that of the recent upward movement, it indicates a sell or short sell position.
When the trading range is defined, crossover signals are generated more frequently, and many of them may be false signals. Therefore, ADX should also be looked at along with the directional indicators. If the ADX is above 25, it indicates that the existing trend, either upward or downward, is strong, and the crossovers generated will prove to be authentic signals. If the ADX is below 25, it indicates that the existing trend is weak, and the cross signals of directional indicators may prove to be false signals.
The directional indicators ensure a price momentum and thus help to increase the chances of the trade to be profitable. Hence, the investors can look at directional indicators like the negative directional indicator before making a trading decision.

Where:
The negative directional indicator can be calculated using the following steps:
1. Find -DM.
-DM = Prior Low Price – Current Low Price
2. Count the period as -DM if:
Previous Low Price – Current low price > Previous High Price – Current High Price
Otherwise, count as +DM.
3. Find TR.
TR = Maximum [(Current High – Current Low), abs (Current High – Previous Close), abs (Previous Close – Current Low)]
Where:
4. Record the value of TR for 14 periods and then take an average. It gives the ATR value for the initial 14-period.
5. For subsequent periods, use the below formula to get smooth data:
Current ATR = [(Prior ATR * 13) + Current TR] / 14
One can also use the below formula to level the 14-period TR value and use that to find the Negative Directional Indicator.
Next 14-Period Value of TR = Previous 14-Period Value of TR – (Previous 14-Period Value of TR)/14 + Current TR
Either of the above two formulas can be used. However, the formula chosen should be followed consistently.
6. For a smoothed value of -DM, find out the 14-period value of -DM.
First 14-Period Value of -DM = Sum of First 14 Readings of -DM
For the next 14-period, apply the formula used to smooth TR replacing TR by -DM, given as:
Next 14-Period Value of -DM = Previous 14-Period Value of -DM – (Previous 14-Period Value of -DM) /14 + Current -DM


