Get Certified for
Capital Markets (CMSA®)
From equities and fixed income to derivatives, the CMSA certification bridges the gap from where you are now to where you want to be — a world-class capital markets analyst.
A technique used by investors in deciding where to invest based on the amount of risk that they can accept
Mean-Variance Analysis is a technique that investors use to make decisions about financial instruments to invest in, based on the amount of risk that they are willing to accept (risk tolerance). Ideally, investors expect to earn higher returns when they invest in riskier assets.
When measuring the level of risk, investors consider the potential variance (which is the volatility of returns produced by an asset) against the expected returns of that asset. Mean-variance analysis essentially looks at the average variance in the expected return from an investment.
The mean-variance analysis is a component of Modern Portfolio Theory (MPT). This theory is based on the assumption that investors make rational decisions when they possess sufficient information. One of the theory’s assumptions is that investors enter the market to maximize their returns while at the same time avoiding unnecessary risk.
When choosing a financial asset to invest in, investors prefer the asset with lower variance when choosing between two otherwise identical investments. An investor can achieve diversification by investing in securities with varied variances and expected returns. Proper diversification creates a portfolio where a loss in one security is counter-balanced by a gain in another.
Mean-variance analysis is comprised of two main components, as follows:
Variance measures how distant or spread the numbers in a data set are from the mean, or average. A large variance indicates that the numbers are further spread out. A small variance indicates a small spread of numbers from the mean.
The variance may also be zero, which indicates no deviation from the mean. When analyzing an investment portfolio, variance can show how the returns of a security are spread out during a given period.
The second component of mean-variance analysis is expected return. This is the estimated return that a security is expected to produce. Since it is based on historical data, the expected rate of return is not 100% guaranteed.
If two securities offer the same expected rate of return, but one comes with a lower variance, most investors prefer that security.
Similarly, if two securities show the same variance, but one of the securities offers a higher expected return, investors opt for the security with the higher return. When trading multiple securities, an investor can choose securities with different variances and expected returns.
Assume a portfolio comprised of the following two stocks:
Stock A: $200,000 with an expected return of 5%.
Stock B: $300,000 with an expected return of 7%.
The total value of the portfolio is $500,000, and the weight of each stock is as follows:
Stock A = $200,000 / $500,000
= 40%
Stock B = $300,000 / $500,000
= 60%
The expected rate of return is obtained as follows:
= (40% x 5%) + (60% x 7%)
= 2% + 4.2%
= 6.2%
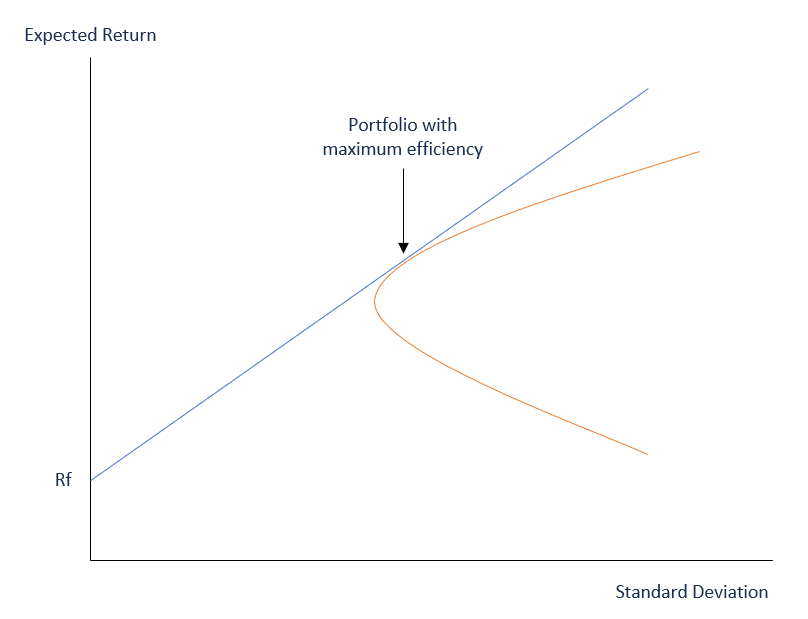
When creating an investment strategy, the goal of every investor is to create a portfolio of stocks that offer the highest long-term returns without getting into high levels of risk. Modern Portfolio Theory, which includes mean-variance analysis, is based on the idea that investors are risk-averse. Therefore, they focus on creating a portfolio that optimizes the expected return according to a specific level of risk. Investors understand that risk is an inherent part of high-return stocks. The solution for minimizing risk is to diversify the investment portfolio.
A portfolio can be comprised of stocks, bonds, mutual funds, etc., which when combined, come with varying levels of risk. If one security decreases in value, ideally, the loss is compensated by a gain in another security.
A portfolio comprised of various types of securities is considered a better strategic move, as compared to a portfolio comprised of only one type of security. Mean-variance analysis can be an important part of an investment strategy.
Thank you for reading CFI’s guide on Mean-Variance Analysis. To keep learning and advancing your career, the following resources will be helpful:

Become a certified Financial Modeling and Valuation Analyst (FMVA)® by completing CFI’s online financial modeling classes!


