Get Certified for
Capital Markets (CMSA®)
From equities and fixed income to derivatives, the CMSA certification bridges the gap from where you are now to where you want to be — a world-class capital markets analyst.
A measurement of the 30-day expected volatility of the US stock market
The Chicago Board Options Exchange (CBOE) created the VIX (CBOE Volatility Index) to measure the 30-day expected volatility of the US stock market, sometimes called the “fear index”. The VIX is based on the prices of options on the S&P 500 Index and is calculated by aggregating weighted prices of the index’s call and put options over a wide range of strike prices.
Volatility measures the frequency and magnitude of price movements over time. The more rapid and substantial the price changes, the greater the volatility. It can be measured with historical values or expected future prices. The VIX is a measure of expected future volatility.
The VIX is intended to be used as an indicator of market uncertainty, as reflected by the level of volatility. The index is forward-looking in that it seeks to predict variability of future market price action.
The fact that this metric represents expected volatility is very important. It is based on the premiums that investors are willing to pay for the right to buy or sell a stock, rather than being a direct measure of volatility. The premiums for options can be seen as representing the perceived level of risk in the market. The greater the risk, the more people are willing to pay for “insurance” in the form of options. When premiums on options decline, so does the VIX.
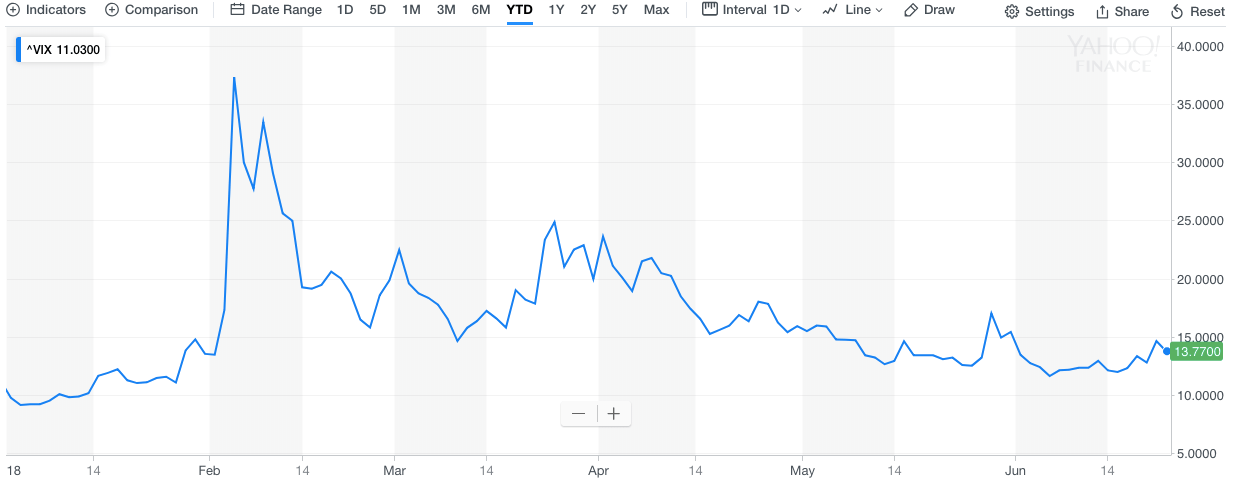
The VIX is given as a percentage, representing the expected movement range over the next year for the S&P 500, at a 68% confidence interval. In the above graph, the volatility index is quoted at 13.77%. It means that the annualized upward or downward change of the S&P 500 is expected to be no more than 13.77% within the next year, with a 68% probability.
The monthly, weekly, or daily expected volatility can be calculated from the annual expected volatility. There are 12 months, 52 weeks, or 252 trading days in a year. By using the annual expected volatility of 13.77% from above, the calculations are as follows:

A high VIX indicates high expected volatility and a low VIX number indicates low expected volatility.
When investors anticipate large upswings or downswings in stock prices, they often hedge their positions with options. Those who own call or put options are only willing to sell them if they receive a sufficiently large premium. An aggregate increase in option prices (which indicates greater market uncertainty and higher projected volatility), will raise the VIX and, thereby, indicate to investors the probability of increasing volatility in the market.
The VIX is considered a reliable reflection of option prices and likely future volatility in the S&P 500 Index.
The long-term average for the VIX volatility index is 18.47% (as of 2018).
Historically speaking, a VIX below 20% reflects a healthy and relatively moderate-risk market. However, if the volatility index is extremely low, it may imply a bearish view of the market.
A VIX of greater than 20% signifies increasing uncertainty and fear in the market and implies a higher-risk environment. During the 2008 Financial Crisis, the volatility index skyrocketed to extreme levels of above 50%. That meant that option traders expected stock prices to fluctuate widely, between a 50% upswing or downswing within the next year, 68% of the time. At one point during the crisis, the index reached as high as 85%.
Although VIX levels can be very high during times of crisis, extreme levels are rarely sustained for extended periods of time. This is because the market conditions lead traders to take actions to reduce their risk exposure (such as purchasing or selling options). That, in turn, reduces the levels of fear and uncertainty in the market.
Thank you for reading CFI’s explanation of the VIX – the “fear index”. CFI is the official provider of the global Capital Markets & Securities Analyst (CMSA®) certification program, designed to help anyone become a world-class financial analyst. To keep learning and advancing your career, the additional resources below will be useful:


