Get Certified for
Capital Markets (CMSA®)
From equities and fixed income to derivatives, the CMSA certification bridges the gap from where you are now to where you want to be — a world-class capital markets analyst.
A mathematical model of the stock market
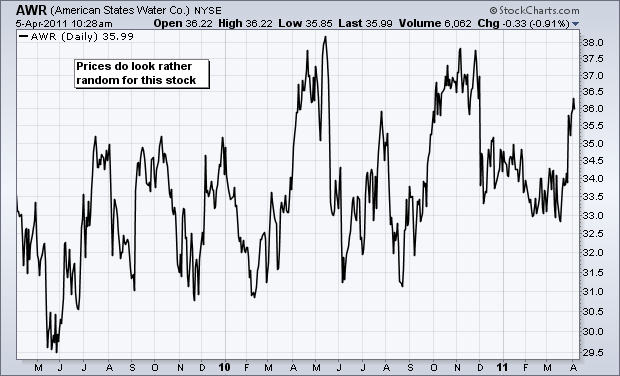
The Random Walk Theory, or the Random Walk Hypothesis, is a mathematical model of the stock market. Proponents of the theory believe that the prices of securities in the stock market evolve according to a random walk.
A “random walk” is a statistical phenomenon where a variable follows no discernible trend and moves seemingly at random. The random walk theory, as applied to trading, most clearly laid out by Burton Malkiel, an economics professor at Princeton University, posits that the price of securities moves randomly (hence the name of the theory) and that, therefore, any attempt to predict future price movement, either through fundamental or technical analysis, is futile.
The implication for traders is that it is impossible to outperform the overall market average other than by sheer chance. Those who subscribe to the random walk theory recommend using a “buy and hold” strategy, investing in a selection of stocks that represent the overall market – for example, an index mutual fund or ETF based on one of the broad stock market indexes, such as the S&P 500 Index.
In 1863, a French mathematician turned stock broker named Jules Regnault published a book titled “Calcul des Chances et Philosophie de la Bourse” or “The Study of Chance and the Philosophy of Exchange.” Regnault’s work is considered one of the first attempts at the use of advanced mathematics in the analysis of the stock market.
Influenced by Regnault’s work, Louis Bachelier, another French mathematician, published a paper titled “Théorie de a Spéculation” or the “Theory of Speculation.” This paper is credited with establishing the ground rules that would be key to the use of mathematics and statistics in the stock market.
In 1964, American financial economist Paul Cootner published a book entitled “The Random Character of Stock Market Prices.” Considered a classic text in the field of financial economics, it inspired other works such as “A Random Walk Down Wall Street” by Burton Malkiel (another classic) and “Random Walks in Stock Market Prices” by Eugene Farma.
Since the Random Walk Theory posits that it is impossible to predict the movement of stock prices, it is also impossible for a stock market investor to outperform or “beat” the market in the long run. It implies that it is impossible for an investor to outperform the market without taking on large amounts of additional risk.
As such, the best strategy available to an investor is to invest in the market portfolio, i.e., a portfolio that bears a resemblance to the total stock market and whose price reflects perfectly the movement of the prices of every security in the market.
A flurry of recent performance studies reiterating the failure of most money managers to consistently outperform the overall market has indeed led to the creation of an ever-increasing number of passive index funds.
Also, it appears that an increasing number of investors are firm believers in the wisdom of index investing. According to data from Vanguard and Morningstar, 2016 saw an unprecedented inflow of more than $235 billion into index funds.
In 1988, the Random Walk Theory was put to the test in the famous Dart Throwing Investment Contest. Devised by the Wall Street Journal, this contest pitted professional investors working out of the New York Stock Exchange against dummy investors. The dummy investors consisted of the Wall Street Journal staff who chose stocks by throwing darts at a board.
The experiment, titled “The Wall Street Journal Dartboard Contest,” gained much fanfare and media attention. Out of 100 contests, the professional investors won 61, whereas the dart-throwing dummies won 39. However, the professional investors only beat the market (as represented by the performance of the Dow Jones Industrial Average) 51 times out of 100.
One of the main criticisms of the Random Walk Theory is that the stock market consists of a large number of investors, and the amount of time each investor spends in the market is different. Thus, it is possible for trends to emerge in the prices of securities in the short run, and a savvy investor can outperform the market by strategically buying stocks when the price is low and selling stocks when the price is high within a short time span.
Other critics argue that the entire basis of the Random Walk Theory is flawed and that stock prices do follow patterns or trends, even over the long run. They argue that because the price of a security is affected by an extremely large number of factors, it may be impossible to discern the pattern or trend followed by the price of that security. However, just because a pattern cannot be clearly identified, that doesn’t mean that a pattern does not exist.
In contrast to the Random Walk Theory is the contention of believers in technical analysis – those who think that future price movements can be predicted based on trends, patterns, and historical price action. The implication arising from this point of view is that traders with superior market analysis and trading skills can significantly outperform the overall market average.
Both sides can present evidence to support their position, so it’s up to each individual to choose what they believe. However, there is one fact – perhaps a decisive one – which goes against the random walk theory. This is the fact that there are some individual traders who consistently outperform the market average for long periods of time.
According to the Random Walk Theory, a trader should only be able to outperform the overall market average by chance or luck. It would allow for there to be some traders who, at any given point in time, would – purely by chance – be outperforming the market average.
However, what are the odds that the same traders would be “lucky” year in and year out for decades? Yet there are indeed such traders, people like Paul Tudor Jones, who have managed to generate significantly above-average trading returns on a consistent basis over a long span of time.
It’s important to note that even the most devout believers in technical analysis – those who think that future price movements in the market can be predicted – don’t believe that there’s any way to infallibly predict future price action. It is more accurate to say that probable future price movement can be predicted by using technical analysis and that by trading based on such probabilities, it is possible to generate higher returns on investment.
So, who do you believe? If you believe in the Random Walk Theory, then you should just invest in a good ETF or mutual fund designed to mirror the performance of the S&P 500 Index and hope for an overall bull market.
If, on the other hand, you believe that price movements are not random, then you should be polishing your fundamental and/or technical analysis skills, confident that doing such work will pay off with superior profits through actively trading the market.
To keep learning and advancing your career, the following resources will be helpful:


