Get Certified for Financial Modeling (FMVA)®
Gain in-demand industry knowledge and hands-on practice that will help you stand out from the competition and become a world-class financial analyst.
When evaluating a company’s profitability, two key metrics often come into play: EBITDA (Earnings Before Interest, Taxes, Depreciation, and Amortization) and Net Income. While both provide valuable insights into financial performance, they serve different purposes in financial analysis, modeling, valuation, and decision-making.
Understanding the differences between EBITDA and Net Income is essential for finance professionals, investors, and business leaders. This guide breaks down each metric, their advantages and limitations, and how they are used in financial modeling.
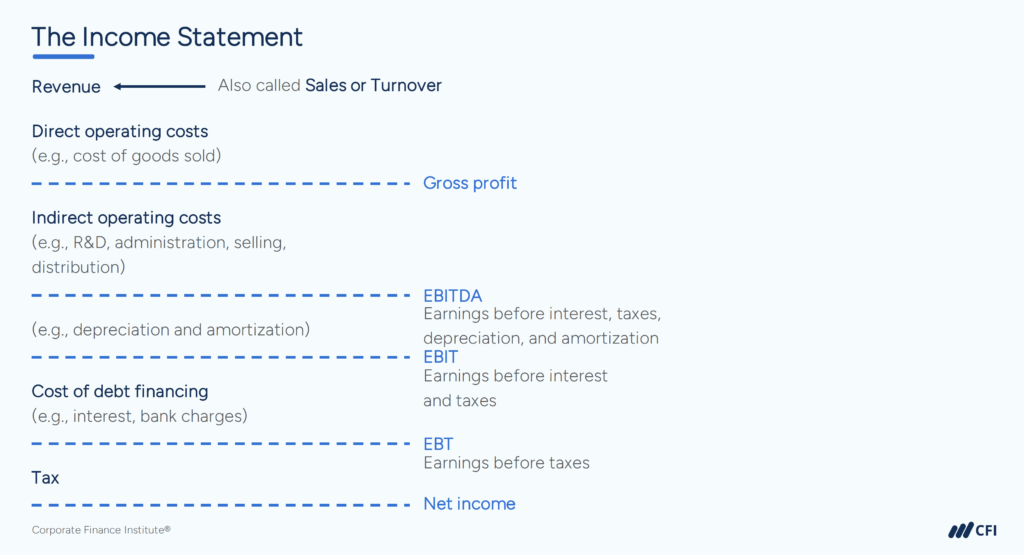
EBITDA measures the profitability of a company’s core operating performance. It focuses on earnings before accounting for debt financing and non-cash expenses.
Or, if you have Operating Income (EBIT):
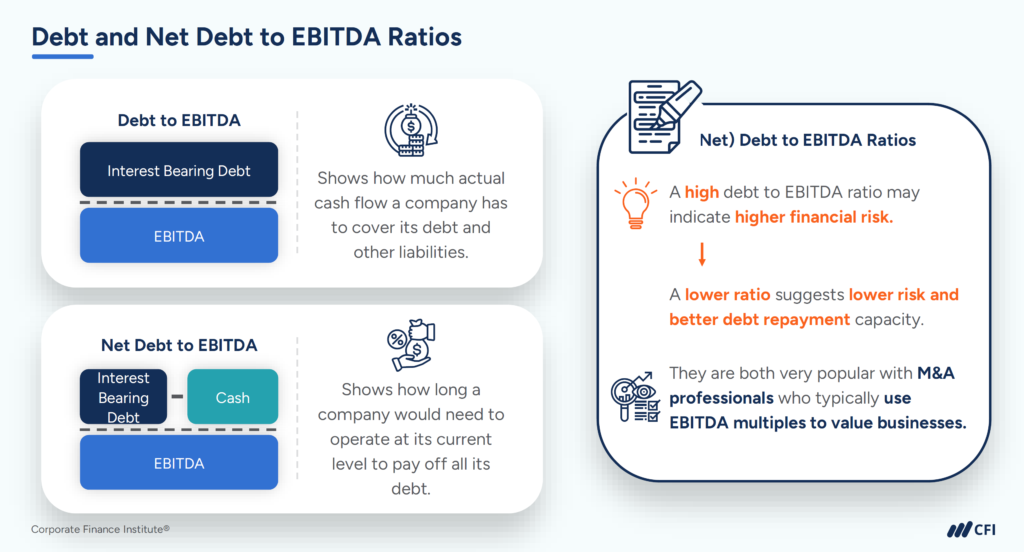
| • Evaluates Core Profitability - Strips away financing and tax effects to highlight operational efficiency. • Used in Valuation - EV/EBITDA is a common multiple to compare companies. • Helps with Lender Analysis - Lenders assess EBITDA vs. debt obligations when reviewing loan applications. | • Excludes Capital Expenditures (CapEx) - Does not account for necessary investments in long-term assets. • Not a GAAP Measure for companies based in the US. Calculations vary across companies, leading to inconsistencies. • Overstates Profitability - By removing interest and taxes, it can make a company appear more profitable than it actually is. |
Financial analysts use EBITDA in several key ways:
Net Income, also called the bottom line, is a company’s true profit after subtracting all expenses, including operating costs, interest, taxes, depreciation, and amortization. It represents the amount available to shareholders or reinvested into the business.
| • Measures Overall Profitability -Net income reflects how much the company actually earns. • Used in Earnings Per Share (EPS) - A critical measure for investors. • Directly Impacts Retained Earnings - Net income flows into shareholder equity. | • Includes Non-Operating Expenses - Can be affected by one-time gains/losses or tax strategies. • Less Ideal for Valuation Comparisons - Financing structures can distort comparisons. |
Example: Calculating EBITDA vs. Net Income for a Company
Let’s apply these concepts to a real-world financial example to further illustrate the differences between EBITDA and Net Income.
You compile the following financial data for Company ABC:
Net Income appears on company income statements, or you can use the Net Income formula:
Net Income = Revenue − COGS − Operating Expenses − Interest − Taxes − Depreciation − Amortization
Net Income = $5,000,000 − $2,000,000 − $1,000,000 − $100,000 − $150,000 − $200,000
Net Income = $1,550,000 or $1.55 million
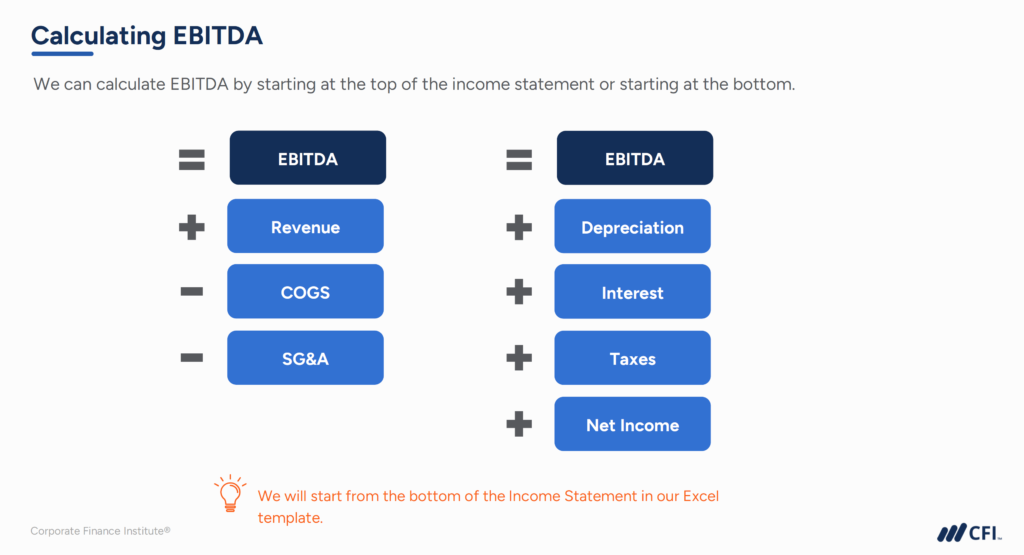
Because EBITDA is a Non-GAAP measure, it does not appear in company financial statements. You need to calculate it using the EBITDA formula:
EBITDA = Net Income + Interest + Taxes + Depreciation + Amortization
EBITDA = 1,550,000 + 100,000 + 150,000 + 200,000
EBITDA = $2,000,000 or $2 million
A financial analyst reviewing these results would interpret EBITDA and Net Income in different ways depending on whether they need to assess operational performance, profitability, or valuation.
Both EBITDA and Net Income are important financial metrics, but they serve different purposes:
When analyzing a business, understanding when to use EBITDA vs. Net Income is crucial for making informed financial decisions.
Ready to transform into a world-class financial analyst? Earning an industry-recognized Financial Modeling & Valuation Analyst (FMVA®) Certification from CFI equips you with practical skills and real-world expertise to stand out in today’s competitive market.


