Get Certified for Financial Modeling (FMVA)®
Gain in-demand industry knowledge and hands-on practice that will help you stand out from the competition and become a world-class financial analyst.
Net income divided by total revenue, expressed as a percentage
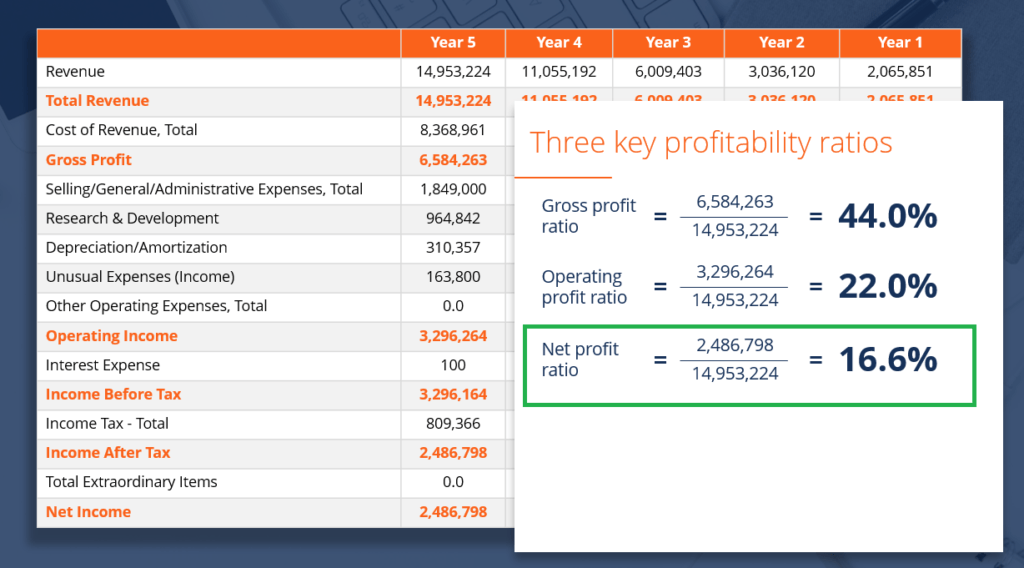
Net Profit Margin (also known as “Profit Margin” or “Net Profit Margin Ratio”) is a financial ratio used to calculate the percentage of profit a company produces from its total revenue. It measures the amount of net profit a company obtains per dollar of revenue gained. The net profit margin is equal to net profit (also known as net income) divided by total revenue, expressed as a percentage.

The typical profit margin ratio of a company can be different depending on which industry the company is in. As a financial analyst, this is important in day-to-day financial analysis.
Source: CFI Financial Analysis Fundamentals Course.
Net Profit Margin = Net Profit ⁄ Total Revenue x 100
Net profit is calculated by deducting all company expenses from its total revenue. The result of the profit margin calculation is a percentage – for example, a 10% profit margin means for each $1 of revenue the company earns $0.10 in net profit. Revenue represents the total sales of the company in a period.
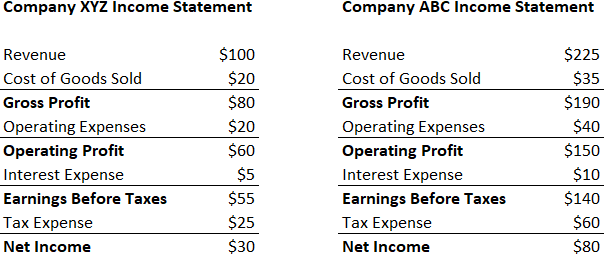
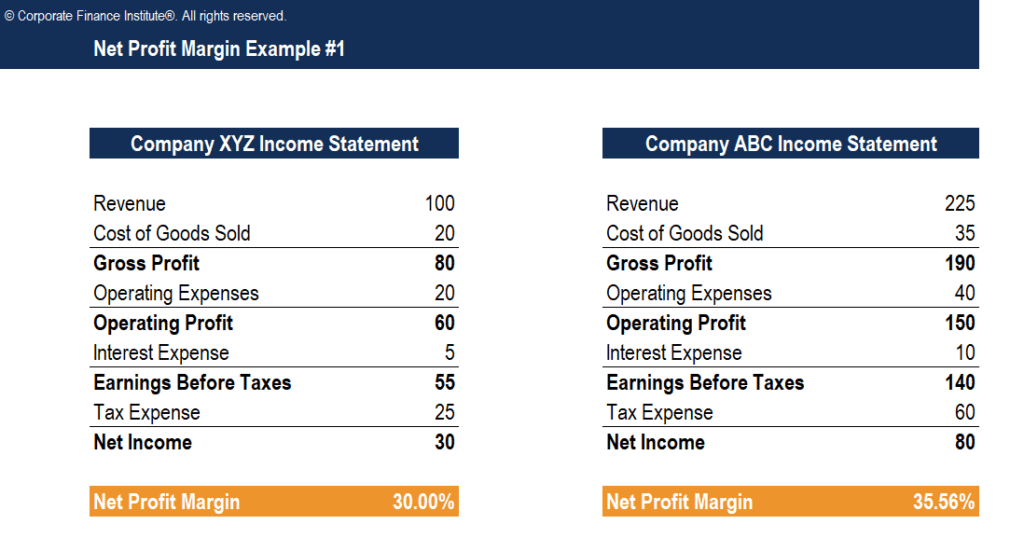
Company XYZ and ABC both operate in the same industry. Which company has a higher net profit margin?
Step 1: Write out the formula
Net Profit Margin = Net Profit/Revenue
Step 2: Calculate the net profit margin for each company
Company XYZ:
Net Profit Margin = Net Profit/Revenue = $30/$100 = 30%
Company ABC:
Net Profit Margin = Net Profit/Revenue = $80/$225 = 35.56%
Company ABC has a higher net profit margin.
Company A and company B have net profit margins of 12% and 15% respectively. Both companies earned $150 in revenue. How much net profit did each company make?
Step 1: Write out formula
Net Profit Margin = Net Profit/Revenue
Net Profit = Net Margin * Revenue
Step 2: Calculate net profit for each company
Company A:
Net Profit = Net Margin * Revenue = 12% * $150 = $18
Company B:
Net Profit = Net Margin * Revenue = 15% * $150 = $22.50
Company A and B earned $83.50 and $67.22 in net profit respectively. Both companies have a net profit margin of 18.22%. How much revenue did each company earn?
Step 1: Write out formula
Net Profit Margin = Net Profit/Revenue
Revenue = Net Profit/Net Profit Margin
Step 2: Calculate revenue for each company
Company A:
Revenue = $83.50/18.22% = $458.29
Company B:
Revenue = $67.22/18.22% = $368.94
Click the button below to download our free Net Profit Margin template!
Below is a video explanation from CFI’s Financial Analysis Fundamentals Course of how net profit margin is calculated and what it means when analyzing a company’s performance.
Get more video tutorials in CFI’s Financial Analyst Training Program.
The net profit margin ratio is used to describe a company’s ability to produce profit and to consider several scenarios, such as an increase in expenses which is deemed ineffective. It is used extensively in financial modeling and company valuation.
Net profit margin is a strong indicator of a firm’s overall success and is usually stated as a percentage. However, keep in mind that a single number in a company report is rarely adequate to point out overall company performance. An increase in revenue might translate to a loss if followed by an increase in expenses. On the other hand, a decrease in revenue, followed by tight control over expenses, might put the company further in profit.
Other common financial metrics are EBITDA and Gross Profit.
A high net profit margin means that a company is able to effectively control its costs and/or provide goods or services at a price significantly higher than its costs. Therefore, a high ratio can result from:
A low net profit margin means that a company uses an ineffective cost structure and/or poor pricing strategies. Therefore, a low ratio can result from:
Investors need to take numbers from the profit margin ratio as an overall indicator of company profitability performance and initiate deeper research into the cause of an increase or decrease in the profitability as needed.
When calculating the net profit margin ratio, analysts commonly compare the figure to different companies to determine which business performs the best.
While this is common practice, the net profit margin ratio can greatly differ between companies in different industries. For example, companies in the automotive industry may report a high profit margin ratio but lower revenue as compared to a company in the food industry. A company in the food industry may show a lower profit margin ratio, but higher revenue.
It is recommended to compare only companies in the same sector with similar business models.
Other limitations include the possibility of misinterpreting the profit margin ratio and cash flow figures. A low net profit margin does not always indicate a poorly performing company. Also, a high net profit margin does not necessarily translate to high cash flows.
A jewelry company that sells a few expensive products may have a much higher profit margin as compared to a grocery store that sells many cheap products.
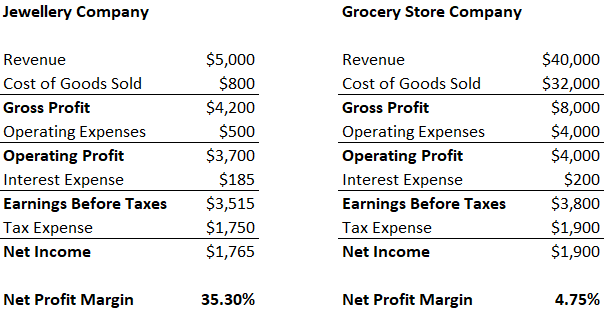
It’d be inappropriate to compare the margins for these two companies, as their operations are completely different.
If a company has higher financial leverage than another, then the firm with more debt financing may have a smaller net profit margin due to the higher interest expenses. This negatively affects net profit, lowering the net profit margin for the company.
Companies with high property plant & equipment (PP&E) assets will be affected by higher depreciation expenses, lowering the firm’s net profit margin. This may be misleading because the company could have significant cash flow but may seem inferior due to their lower profit margin.
Management may reduce long-term expenses (such as research and development) to increase their profit in the short-term. This can mislead investors looking at net margin, as a company can boost their margin temporarily.
Calculating the net margin of a business is a routine part of financial analysis. It is part of a type of analysis known as vertical analysis, which takes every line item on the income statement and divides it into revenue. To compare the margin for a company on a year-over-year (YoY) basis, a horizontal analysis is performed. To learn more, read CFI’s free guide to analyzing financial statements.
To learn more via online courses, check out our wide range of topics such as:
Connect what you just learned to a clear career path with CFI’s role‑based courses and certification programs.


