Get Certified for
Capital Markets (CMSA®)
From equities and fixed income to derivatives, the CMSA certification bridges the gap from where you are now to where you want to be — a world-class capital markets analyst.
A technical indicator that shows how the price of an asset or security changes over a certain period of time
The Exponential Moving Average (EMA) is a technical indicator used in trading practices that shows how the price of an asset or security changes over a certain period of time. The EMA is different from a simple moving average in that it places more weight on recent data points (i.e., recent prices).
The aim of all moving averages is to establish the direction in which the price of a security is moving based on past prices. Therefore, exponential moving averages are lag indicators. They are not predictive of future prices; they simply highlight the trend that is being followed by the stock price.
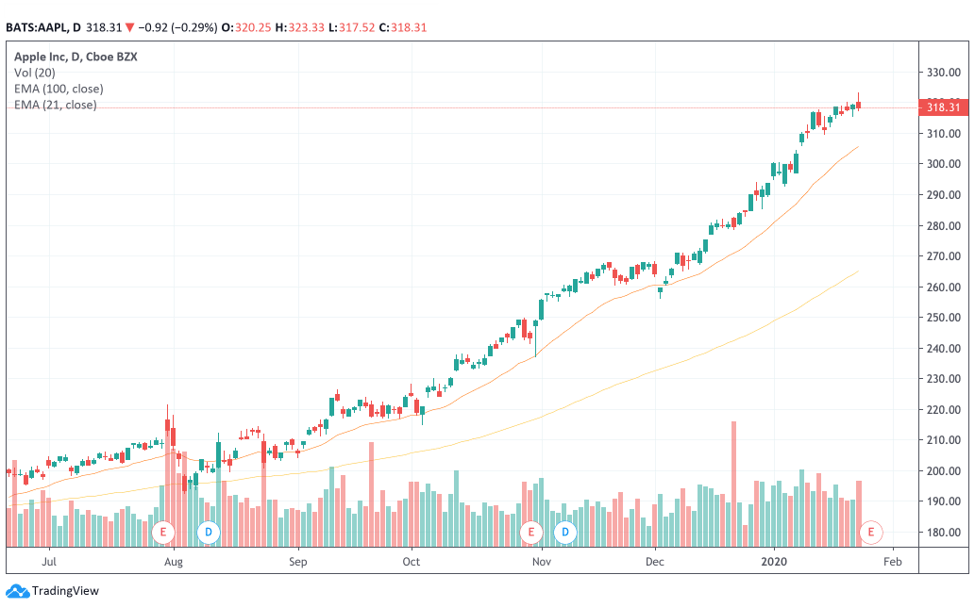
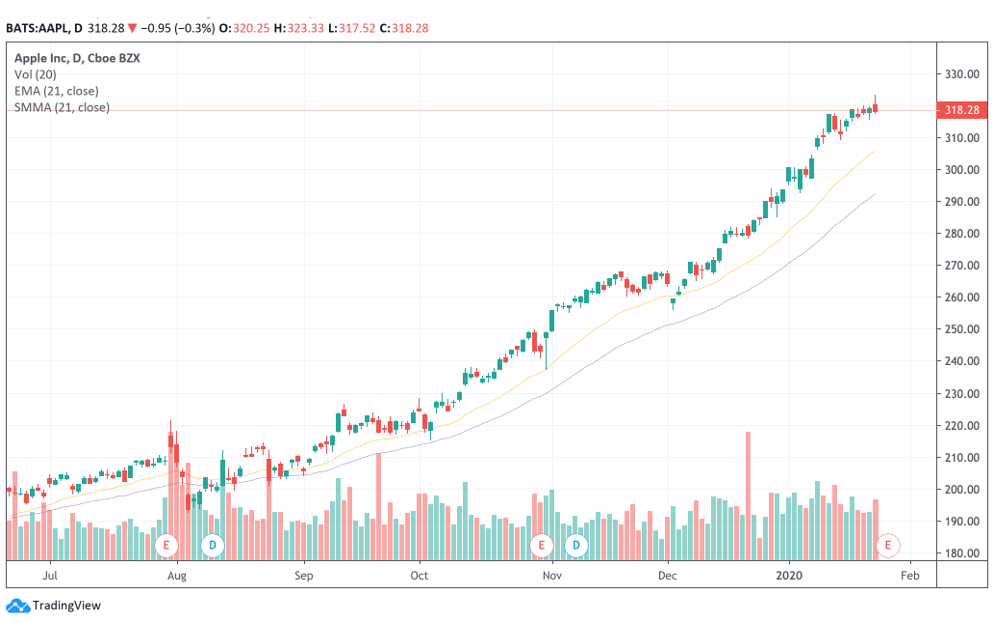
The chart below shows how the price of Apple’s stock (NASDAQ: AAPL) changed over a six-month period. Each candlestick shows how the price of the stock changed over one trading day (there are, on average, 21 trading days in a month), with green candlesticks indicating a rise in the stock price and red candlesticks representing price drops.

The orange line below the candlesticks is the EMA line, which indicates that the price’s been following an upward trend over the period of July 2019 – January 2020. The 21-day EMA line moves closely with Apple’s stock price and is sensitive to volatility, which makes it a useful indicator for investors that are looking to enter or exit trades.
An important caveat to note is that EMAs taken over shorter periods of time are more sensitive to prices. So, a 21-day EMA line (orange) follows the prices more closely compared to a 100-day EMA line (yellow), as shown below:
The formula for calculating the EMA is as follows:
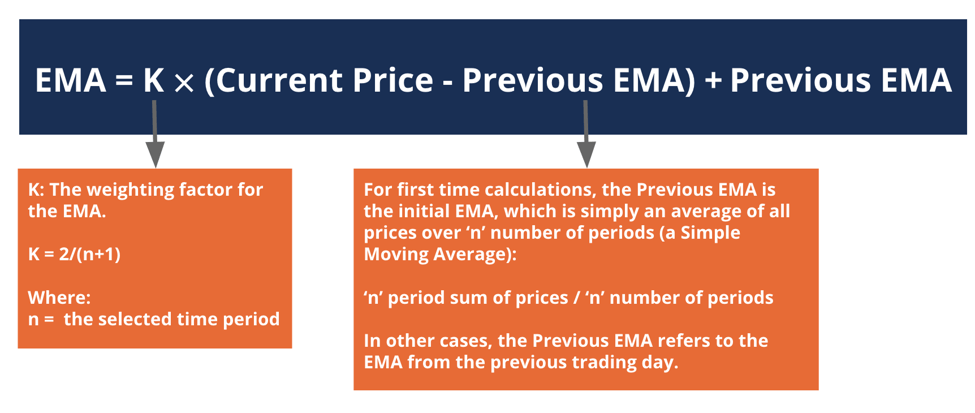
As exemplified in the chart above, EMAs calculated over a fewer number of periods (i.e., based on more recent prices) show a higher weightage than those calculated over longer periods. It can be shown by calculating the value of “K” for two different time periods:
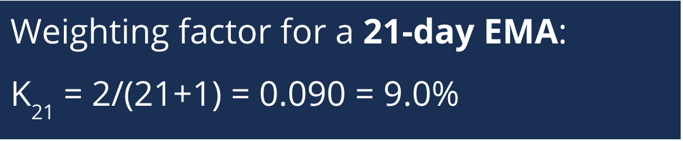
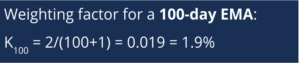
The 21-day EMA places a 9.0% weight on the most recent price, whereas the 100-day EMA only places a 1.9% weight. Therefore, EMAs calculated over shorter periods are more responsive to price changes than those calculated over longer periods.
Download our free Moving Averages Excel template, and start modeling today!
Highlighting and identifying price trends are one of the most important functions of an EMA. A rising EMA indicates that prices are on an upward trend and vice versa. When the price is above the EMA line, it is likely to rise, and when it is below, it’s likely to fall. By identifying price directions, the EMA allows investors and traders to spot buying and selling signals based on their trading strategy.
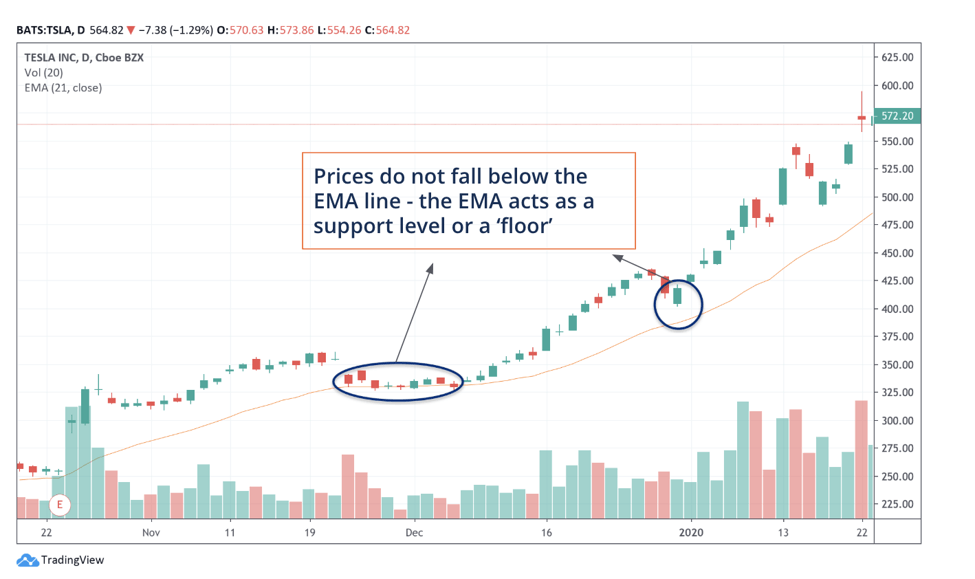
The EMA and other types of moving averages also function as support and resistance levels for prices. Support levels are also known as “floors” – they act as the limit for how far prices are expected to fall during uptrends. It is illustrated in the chart below, which shows the price action and 21-day EMA of Tesla (NASDAQ: TSLA) stock over the period of October 2019 – January 2020:
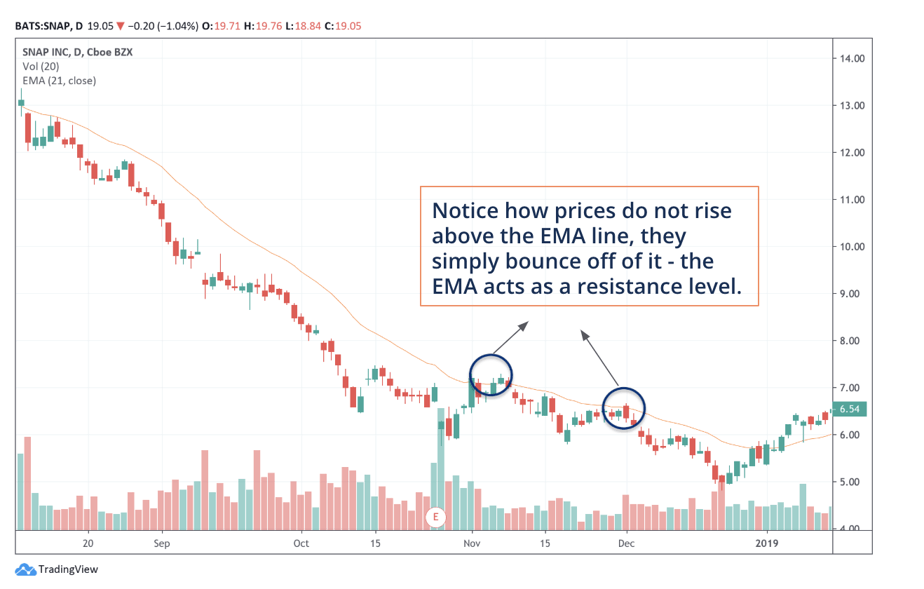
On the other hand, resistance levels are like “ceilings” – prices are not expected to exceed the levels during downtrends. It is highlighted in the chart below, which shows the price action and 21-day EMA of Snapchat (NASDAQ: SNAP INC.) stock over the period of August 2018 – January 2019:
The exponential moving average (EMA) and the simple moving average (SMA) are both technical indicators that use past data to generate a smooth trend line for the price of a security. The difference between the two moving averages is that EMA places a greater weight on recent prices, whereas SMA places equal weight on all data points, which is why the EMA line turns more quickly than the SMA line. It is illustrated in the chart below:
However, it is important to note that none of the moving averages is a better indicator than each other. For example, although an EMA is a more accurate representation of recent price movements and helps identify trends quicker, it also experiences more short-term fluctuations than an SMA. The optimal moving average to use for analysis depends on the trading strategy.
Thank you for reading CFI’s guide on Exponential Moving Average (EMA). To keep learning and advancing your career, the following resources will be helpful:


