Get Certified for
Capital Markets (CMSA®)
From equities and fixed income to derivatives, the CMSA certification bridges the gap from where you are now to where you want to be — a world-class capital markets analyst.
A series of numbers wherein every number is a sum of the two numbers preceding it
Fibonacci Numbers are the numbers found in an integer sequence referred to as the Fibonacci sequence. The sequence is a series of numbers characterized by the fact that every number is the sum of the two numbers preceding it. The initial two numbers in the sequence are either 1 and 1, or 0 and 1, and each successive number is a sum of the previous two as shown below:
1, 1, 2, 3, 5, 8, 13, 21, 34, 55, 89, 144, ……….. or 0, 1, 1, 2, 3, 5, 8, 13, 21, 34, 55, 89, 144…….
The Fibonacci sequence is expressed as follows:

Fibonacci numbers are named after Italian mathematician Leonardo Fibonacci, also known as Leonardo Pisano. In his 1202 book, Liber Abaci, Fibonacci introduced the sequence to European mathematicians, even though the sequence was already known to Indian mathematicians. Since Fibonacci’s father was a merchant, he traveled widely, allowing him to learn the Hindu-Arabic arithmetic system while growing up in Northern Africa.
In Liber Abaci, the mathematician noted the number sequence when thinking about rabbit breeding. The question he posed was: “Assuming that a newly-born pair of rabbits, a male and a female, are put in a field, how many pairs will be there in one year?” He made the assumptions that:
The idea of rabbit breeding is shown in the diagram below:
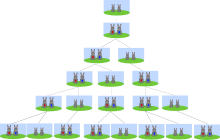
During the first month, the newly born pair of rabbits are yet to reach sexual maturity and, therefore, cannot mate. In the second month, the rabbits mate and give birth to one pair of rabbits at the end of the same month, making it two pairs of rabbits in total. In the third month, the original female rabbit mates and gives birth to a second pair, making it a total of three pairs in the field.
At the end of the fourth month, the original female produces another pair of rabbits, and the female born in the second month also produces the first pair, making it five pairs of rabbits. The pattern continues until the 12th month. In the nth month, the total number of rabbits will be equal to the number of new pairs (n-1) plus the number of pairs alive in the previous month (n-1).
The Fibonacci retracement is a popular tool used by technical traders and is based on the numbers identified by the Italian mathematician. The tool utilizes the mathematical relationships between the numbers in Fibonacci sequences more than the numbers themselves.
It takes the extreme points on a stock chart, such as the low and high price levels of a long-term trend, and divides the vertical distance between them by the Fibonacci ratios of 23.6%, 38.2%, 50%, 61.8%, and 100%. Once the ratio levels are identified, horizontal lines representing the ratio levels are drawn on a chart, indicating possible support (price stops going lower) and resistance (price stops going higher) levels.
In the Fibonacci sequence of numbers, each number is approximately 1.618 times greater than the preceding number. For example, 21/13 = 1.615 while 55/34 = 1.618.
In the key Fibonacci ratios, ratio 61.8% is obtained by dividing one number in the series by the number that follows it. For example, 8/13 = 0.615 (61.5%) while 21/34 = 0.618 (61.8%).
The 38.2% ratio is obtained by dividing one number in the series by a number located two places to the right. For example, 5/13 = 0.385 (38.5%), and 55/144 = 0.3818 (38.2%).
The 23.6% is calculated by dividing one number in the sequence by a number that is three places to the right. For example, 13/55 = 0.236 (23.6%), and 2/8 = 0.23076 (23.1%).
0% is the start of the retracement, while 100% represents a complete reversal of the original part of the move.
Traders use the Fibonacci retracement levels to identify strategic places to trade, stop losses, or target prices to get a favorable price. During an uptrend, Fibonacci retracement levels can be used as potential buy points on pullbacks, while in downtrends the price levels can be used as potential short sell entry points, expecting an upward price retracement to turn back to the downside from a Fibonacci retracement level.
When a Fibonacci price level overlaps with another technical indicator’s price levels, it becomes a fortified price level with an even stronger support or resistance. Unlike moving averages, Fibonacci retracement price levels are static, allowing traders to react when specific price levels are tested. The retracement concept is employed in various indicators such as the Elliot Wave theory, Tirone levels, and Gartley patterns.
Fibonacci extensions are ratio-derived extensions that are beyond the standard 100% retracement level. They are commonly used by traders to determine support and resistance levels that may form in the future and that can be used to identify potential take profit targets. It is most practical to compute Fibonacci extensions when stocks are at new highs or lows, and when there are no clear support and resistance levels on the chart above the new high or below the new low.
However, traders should not rely on Fibonacci extensions alone to make a buy or sell decision. They should watch for other technical indicators, such as candlestick patterns, to confirm potential market reversals.
CFI offers the Capital Markets & Securities Analyst (CMSA)® certification program for those looking to take their careers to the next level. To keep learning and advancing your career, the following resources will be helpful:


