Get Certified for
Capital Markets (CMSA®)
From equities and fixed income to derivatives, the CMSA certification bridges the gap from where you are now to where you want to be — a world-class capital markets analyst.
A line that makes up a candlestick pattern’s wick
In the world of finance and charting, a shadow is a line that makes up a candlestick pattern’s wick – the portion of the candlestick that represents price action outside of the candlestick body formed by the opening and closing prices of the period.
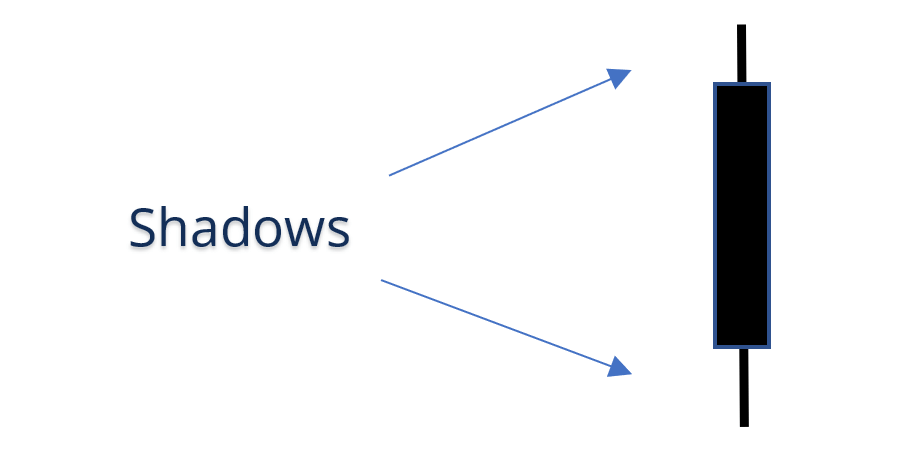
Every candlestick chart must contain a data set with opening, closing, and high and low values. Once charted, the values make a candlestick. Either the hollowed or filled-in portion of the candlestick is the body.
The lines that appear above and below the body are the shadows. While both can be referred to as wicks, in most cases, the line above the body is referred to as the wick, and the line below the body is referred to as the tail. Regardless of what each line may be referred to individually, they are both considered shadows.
On a candlestick chart, the high value in a data set is represented by the very top of the wick or upper shadow. The low value in the data set is represented by the bottom of the tail or the lower shadow.
When any security closes out a price period at a higher price than it opened at, the candlestick is typically charted hollow. In such an instance, the lower end of the candlestick body is a representation of the opening price of the stock. The upper end of the candlestick body represents the closing price.
When a stock closes at a lower price than it opened at, the candlestick is typically filled in. The upper portion of the body represents the opening price, while the lower portion of the body represents the closing price.
The top, or upper shadow, of a candlestick shows the highest value of a data set for the time period charted, and the bottom, or lower shadow, shows the lowest value.
However, there is much more to shadows on a candlestick. They offer traders and analysts important information about how the security performed during the time period. When a candlestick shows a short shadow, it reveals that the majority of the security’s trading activity occurred between the opening and closing prices of the period. If the shadow is longer, it shows that price activity for the security extended well past the open and/or close.
The upper and lower shadows are commonly unequal. When the upper shadow of a candlestick is longer, it signifies strong action on the part of buyers during the trading session. However, the fact that the closing price of the period is substantially lower than the period high reveals that sellers successfully forced the price back down. A strong high and weak close creates a long upper shadow. When the lower shadow is longer, it reveals the opposite: sellers controlled the trading session at some point, driving the price significantly down. Buyers then stepped in before the close to push prices back up. It means the session closed strong; thus, the lower shadow is longer.
Long candlestick shadows on one side or the other – top or bottom – often occur at the end of a trend, just before price action reverses, forming a new trend in the opposite direction.
Sometimes, neither the upper nor lower shadow is longer than the other. When both the wick and tail are of the same length, what’s known as a spinning top candlestick is formed. With such a pattern, the body of the candlestick is typically small. At the heart of it, a spinning top is commonly interpreted as signifying indecisiveness during the time frame charted.
A small body means relatively little price movement throughout the session, while the equally long upper and lower shadows show that both bears and bulls were actively trading. The ultimate result for the time period appears as a sort of stalemate or standoff.
Thank you for reading CFI’s guide on Shadow (Candlestick Wick). To keep advancing your career, the additional resources below will be useful:


