Get Certified for
Capital Markets (CMSA®)
From equities and fixed income to derivatives, the CMSA certification bridges the gap from where you are now to where you want to be — a world-class capital markets analyst.
A technical indicator used to identify new or existing trends in the financial markets
The vortex indicator (VI) is a technical indicator used to identify new or existing trends in the financial markets. Like other technical indicators, the vortex indicator uses historical price data to predict trends in the prices of stocks, commodities, or currencies.
The vortex indicator is composed of two indicator lines, each representing either positive or negative price trends. When constructed as part of the vortex indicator, the lines intersect to produce a vortex shape. Typically, vortex indicators are used as part of trading strategies designed to predict upward or downward price trends based on existing data.
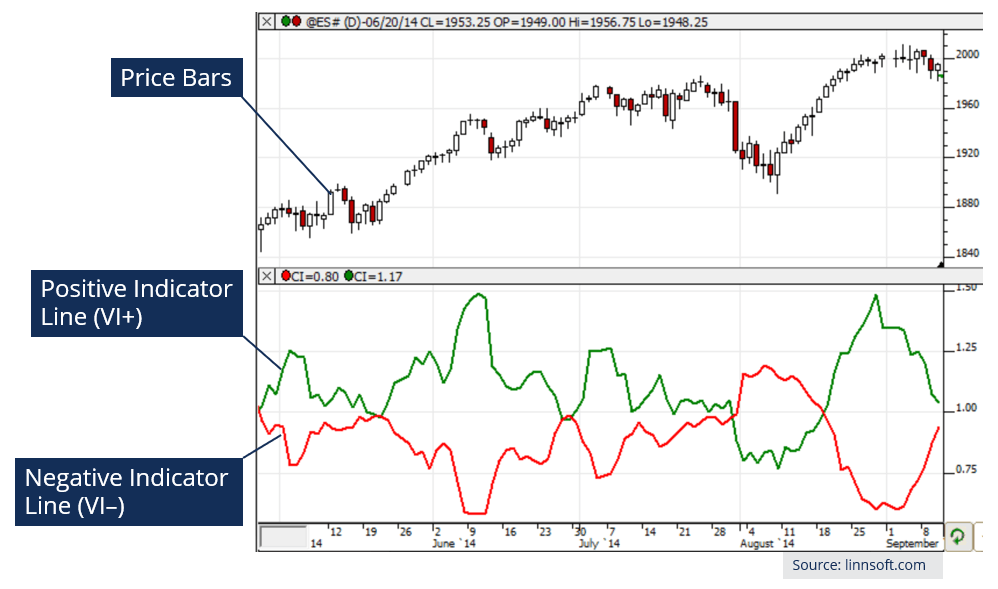
The vortex indicator is a technical indicator that uses historical price data to identify trends in the price of assets such as stocks. The foundations of the VI involve the use of price bars. A price bar is simply a representation of the highest and lowest prices of a stock over time.
For example, the daily price bar of Amazon would show the highest and lowest prices of Amazon stock over a single trading day. The vortex indicator connects the highs of a market’s price bars with the lows of the next price bar.
At the same time, the lows of a market’s price bars are connected to the highs of the subsequent price bar. The two indicator lines provide valuable information on trends in the price of a stock. During periods of strong price trends, the two indicator lines will move further apart. In contrast, indicator lines that move closer together indicate weak trends or periods of relative price stability.
The two indicator lines represent the upward or downward movements of the vortex indicator. When analyzing the vortex indicator, upward trends are referred to as positive vortex (VI+), while downward trends are referred to as negative vortex (VI-).
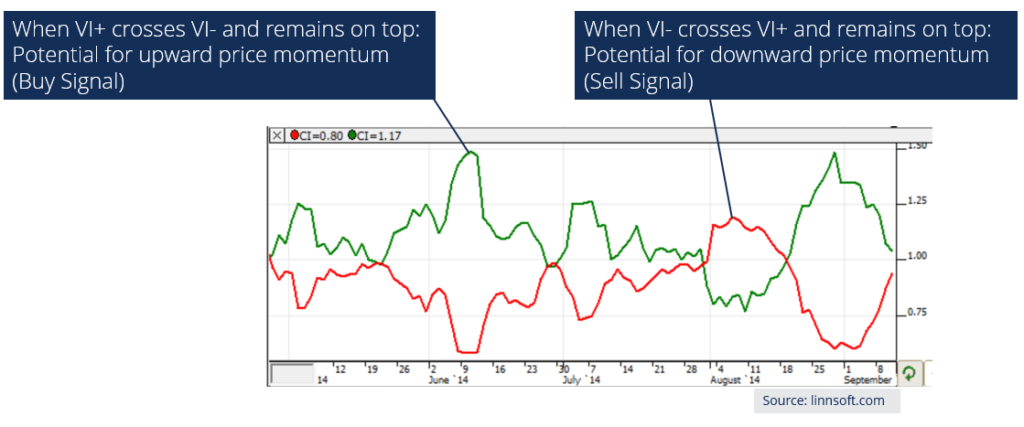
When the positive vortex (VI+) crosses the negative vortex (VI-), it indicates the potential for upward momentum, and if VI+ stays above VI-, it further solidifies a positive price trend. It is also true in the reverse scenario – when VI- crosses VI+, it indicates a potential downward momentum, and if VI- stays above VI+, it further confirms a negative price trend.
Calculating the vortex indicator requires five steps:
1. First, we must calculate the upward and downward movements:
• The upward movement (VM+) is calculated as the current high minus the previous low.
• The downward movement (VM-) is calculated as the current low minus the previous high.
2. Calculate for the number of periods:
• If there are 50 periods in the vortex indicator, then calculate as follows:
VM50+ = 50 period sum of VM+
VM50- = 50 period sum of VM-
3. Calculate the True Range (TR):
• The true range is the maximum of either of the following:
– Current high minus the current low
– Current low minus the previous close
– Current high minus the previous close
*The above must all be absolute values
4. Calculate for the specified period:
For 50 periods: TR50 = 50-period Sum of TR
5. Calculate VI+ and VI-
VI50+ = VM50+ / TR50
VI50- = VM50- / TR50
When interpreting the vortex indicator, an important aspect is the number of periods involved in the calculation. Long-term traders may prefer vortex indicators that span many periods, while short-term traders may prefer vortex indicators that span a few periods.
As the number of periods increases, the sensitivity of the indicator decreases. Recall from earlier that the VI is constructed using price bars. One price bar equals one period, and each period can be equal to one day, one hour, or any length of time.
In the context of trading, vortex indicators can provide information on new or existing trends in the financial markets. When the positive vortex (VI+) crosses the negative vortex (VI-) and remains on top, it indicates the potential for upward price momentum, and would, therefore, produce a buy signal.
In contrast, when the negative vortex (VI-) crosses the positive vortex (VI+) and remains on top, it indicates the potential for downward price momentum and would produce a sell signal. In general, the indicator line (VI+ or VI-) that remains on top indicates whether a stock is experiencing an upward or downward trend.
CFI is the official provider of the global Capital Markets & Securities Analyst (CMSA®) certification program, designed to help anyone become a world-class financial analyst. To keep advancing your career, the additional CFI resources below will be useful:


