Get Certified for
Capital Markets (CMSA®)
From equities and fixed income to derivatives, the CMSA certification bridges the gap from where you are now to where you want to be — a world-class capital markets analyst.
A filtering or smoothing indicator of support and resistance price levels in a market
The Zig Zag indicator is what is known as a filtering or smoothing indicator. Its primary purpose is to filter out insignificant price fluctuations in a security and accurately track the existing trend. It can also be used to identify support and resistance price levels in a market.
This indicator is often employed with Elliott Wave Analysis to help identify the beginning and end of each wave.
The ability to filter out “noise” – insignificant price movements that occur within an overall trend – is important for investors. The Zig Zag indicator is designed to help traders maintain a profitable market position throughout a sustained trend.
The Zig Zag indicator creates trend lines on a chart. They are adjusted only when price movement above a designated percentage occurs. The default value on most versions of the indicator is 5%. This means that the Zig Zag indicator will not register any fluctuation in price that is less than 5%. Traders and market analysts can, of course, set their own minimum percentage values for the indicator. Values between 6% and 10% are commonly-used variations from the default 5% value.
This price movement threshold helps traders avoid being fooled by minor, insignificant price fluctuations. Thus, the Zig Zag indicator helps you stay focused on the overall trend in place. Unfortunately, investors are often “scared” into abandoning profitable positions by insignificant price action.
The Zig Zag draws trendlines on charts which connect swing highs and lows. However, it only produces lines when the highs or lows represent a significant price movement. “Significant” is defined by the percentage move threshold set for the Zig Zag.
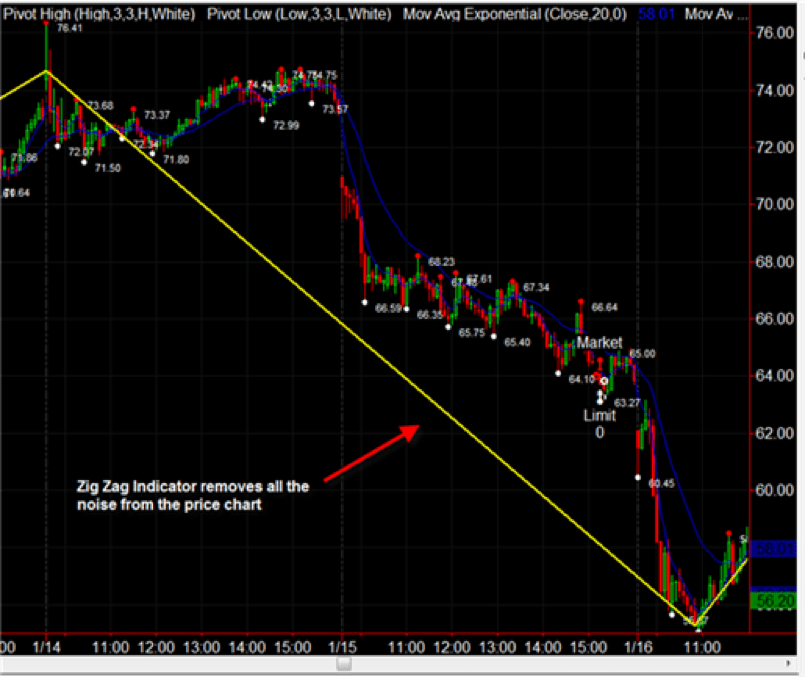
The chart below shows how the Zig Zag (the yellow line) does not react to any of the insignificant, choppy price fluctuations. It successfully manages to indicate the continuing overall downtrend.
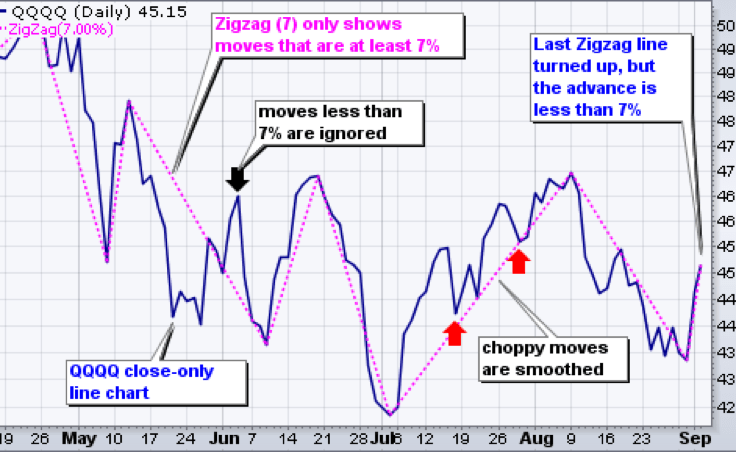
The following chart shows how the Zig Zag operates over time. It reacts by drawing a new trend line only when there is significant price movement. In this case, the “significant” threshold is price change greater than 7%.
Some versions of the indicator allow analysts to set a minimum absolute price change movement rather than a percentage movement. For example, rather than setting the price change threshold at 5%, it might be set at $20.
The operation of the Zig Zag indicator is contingent on the type of chart it is applied to. It operates based on closing prices when applied to line or dot charts. It reacts to the whole price range of each time period when plotted on bar charts or candlestick charts. There is likely to be more fluctuation in the Zig Zag – more trend lines drawn – using bar or candlestick charts since they will reflect a wider range of prices than charts that only reflect closing prices.
Because values for the Zig Zag indicator are plotted only after the close of each time period, and because the Zig Zag will only draw a permanent new line after price has moved significantly, it tends to be very much a lagging indicator.
It’s important to know that the most recent Zig Zag line – the one showing on the far right-hand side of a chart – is not “set in stone”. Whenever the direction of price changes, the Zig Zag will begin drawing a new line in that direction. But if the price movement ultimately fails to reach the Zig Zag’s designated threshold before moving back in the opposite direction, that temporary line will eventually disappear as the Zig Zag begins to draw a new line, based on the most recent price movement.
For example, on the chart above, see the point indicated by an arrow with the notation “moves less than 7% are ignored”. The Zig Zag indicator would initially show a temporary line being drawn upward along with the movement of price. However, when the 7% threshold wasn’t crossed and price subsequently turned back to the downside, that temporary line would disappear, being replaced by an extended downside line connecting to the next swing low.
The swing highs and lows that the Zig Zag indicator identifies may represent future support or resistance levels. It can, therefore, help traders spot key price levels that may be control points for future trading.
The Zig Zag sometimes reveals a major trend change by virtue of the lines it draws marking out a well-known market reversal chart pattern such as the head and shoulders pattern. Traders still need to augment such indications from the Zig Zag with traditional price action analysis, using technical indicators such as moving averages or candlestick patterns.
The important thing to keep in mind is the limited and specific purpose of the Zig Zag indicator. Its purpose is to filter out small, insignificant price fluctuations so that a trader looking at a chart can maintain their focus on the overall trend. For pinpointing trade entry and exit points, traders are better served by more traditional technical indicators applied to price action.
CFI offers the global Capital Markets & Securities Analyst (CMSA®) certification program, designed to help anyone become a world-class financial analyst. The following resources will be helpful in furthering your financial education:


