Get Specialized with our Financial Planning & Analysis (FP&A) Program
Support business leaders in their decision-making with best-in-class financial models to evaluate and forecast the financial performance of a company.
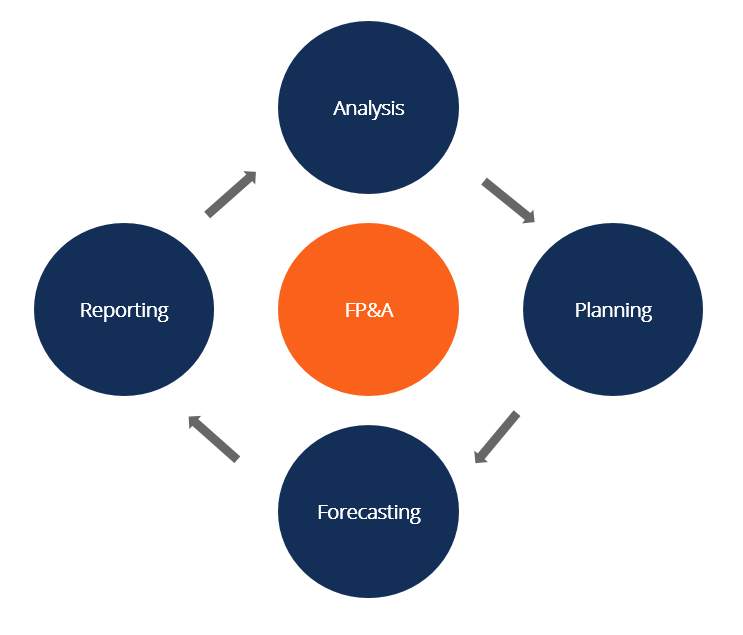
How FP&A supports a corporation
Financial Planning and Analysis (FP&A) teams play crucial company roles by performing budgeting, forecasting, and analysis that support major corporate decisions of the CFO, CEO, and the Board of Directors.
Very few, if any, companies can be consistently profitable and grow without careful financial planning and cash flow management. The job of managing a corporation’s cash flow typically falls to its FP&A team and its Chief Financial Officer (CFO). Read more about the role of the CFO.
Corporate financial planning and analysis professionals utilize both quantitative and qualitative analysis of all operational aspects of a company in order to evaluate the company’s progress toward achieving its goals and to map out future goals and plans.
FP&A analysts consider economic and business trends, review past company performance, and attempt to anticipate obstacles and potential problems, all with an eye toward forecasting a company’s future financial results.
FP&A professionals oversee a broad array of financial affairs, including income, expenses, taxes, capital expenditures, investments, and financial statements. Unlike accountants who are in charge of record-keeping, financial analysts are charged with examining, analyzing, and evaluating the entirety of a corporation’s financial activities, and mapping out the company’s financial future.
To learn more, launch CFI’s FP&A courses!
In a small business, the position of the corporate financial analyst may not exist as a separate job title, but instead effectively be held by the owner, CEO, CFO, or company controller.
Larger companies have a complete corporate financial analysis department, usually headed by either a Director of Financial Planning and Analysis or by the company’s Chief Financial Officer (CFO). Some companies have both positions, with the Director of Financial Analysis reporting to the CFO.
In a large corporate financial analysis department, entry-level junior financial analysts work in small groups headed by a senior financial analyst. In the largest, multinational firms, junior analysts are assigned to evaluate a single product line, or perhaps even a single product. For example, if you worked as a junior analyst at The Hershey Company (NYSE: HSY), you might be assigned to produce all the relevant reports and recommendations regarding just one candy bar.
The chart below provides typical job responsibilities and compensation levels for major positions within the FP&A department of a large corporation.
| CFO or Director of FP&A | Major Strategic Financial Planning | $700k plus bonuses |
| Senior Analyst or Manager | Project Management; Analysis | $100k plus bonuses |
| Junior Analyst | Specific Product(s), Department or Project Review | $60-70k (possible bonus) |
It typically takes about three to five years to make the transition from a junior to a senior financial analyst. Along the way, you might have the opportunity to showcase your skills, getting assigned the title of manager, in charge of a specific financial project, such as changing the way the company does inventory reporting or overseeing a substantial capital expenditure project.
Below are some examples to give a better understanding of how to analyze data and derive business insights:

The above common size analysis illustrates the breakdown of expenses on the income statement. In Year 3, we can see where expenses were favorable (blue-shaded cells) and unfavorable (orange-shaded cell). By identifying favorable and unfavorable results, an FP&A professional can investigate and identify the underlying root causes and make recommendations as necessary.
| Vendor Name | Spending (USD million) | Percentage | |
|---|---|---|---|
| 1 | KPMG | 15.4 | 50% |
| 2 | EY | 5.1 | 17% |
| 3 | ANZ Consulting | 3.1 | 10% |
| 4 | DBS Synergy Ltd | 2.4 | 8% |
| 5 | Others | 4.7 | 15% |
| TOTAL | 30.7 | 100% |
The above table shows the company’s spending on several consulting projects during the year. From the information provided, KPMG got 50% of the company’s business, which highlights the fact that it is highly dependent on KPMG, or KPMG’s charges are significantly higher compared to other firms.
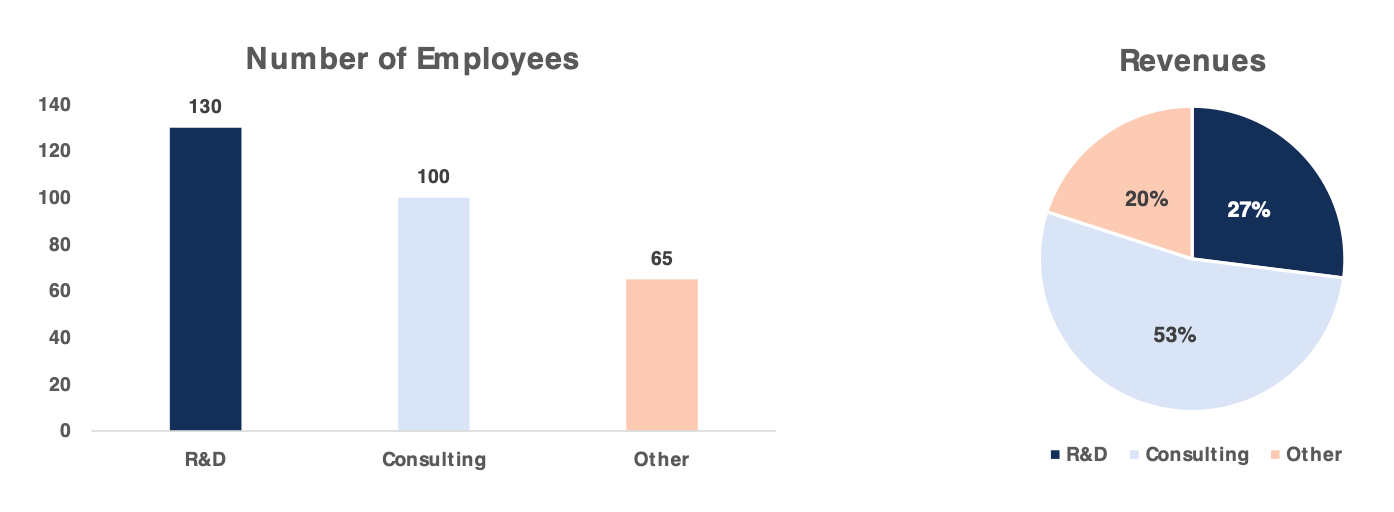
The above graph shows the employee profile in a technology company. Here, the maximum number of employees can be found in the R&D division, which is around 44% of the company’s workforce. However, if you look at the revenue from products created by the R&D division (right graph), it shows that R&D projects contribute only 27% of overall revenue.
Further analysis needs to be done to find out the reasons for the discrepancy. One of the reasons can be that R&D is overstaffed or is not creating many successful projects for the company.
Good financial analysts are individuals capable of handling and intelligently analyzing a mountain of different types of data and data evaluation metrics.
Financial analysts are good problem solvers. They are able to decipher the various puzzle pieces that constitute a company’s finances and envision putting the pieces together to formulate a variety of possible growth scenarios.
If you just don’t like math or working with spreadsheets like Excel, you may want to consider an alternate career choice.
However, if you’re a creative problem solver with a natural or cultivated talent for financial analysis, modeling, and forecasting, then becoming a corporate financial analyst may be the perfect career choice for you.
To see if a financial planning and analysis career is right for you, explore our Interactive Career Map.
Aspiring corporate financial analysts can follow a number of educational paths to success in the industry. Degrees commonly held by analysts include accounting, business administration, statistics, and finance. The logical post-graduate course of study for financial analysts is an MBA degree.
CFI offers professional FP&A courses, along with continuing education training, all online. Having a certification from CFI helps with landing jobs, securing promotions, and being able to command higher levels of compensation.
Some corporate financial analysts also seek professional certification in the arena of investing, obtaining credentials such as Certified Financial Planner (CFP), Financial Risk Manager (FRM), or Financial Modeling and Valuation Analyst (FMVA).
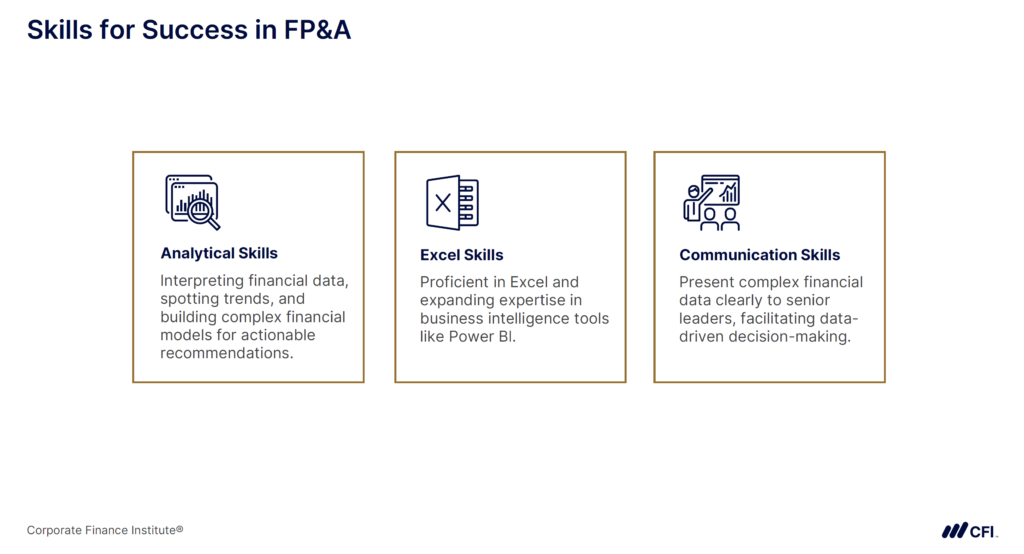
Success as an FP&A analyst requires more than just a knack for numbers. It’s about mastering a blend of technical, analytical, and interpersonal skills to help businesses make data-driven decisions. Tesla’s early financial journey offers a glimpse into the critical capabilities that every FP&A professional needs to excel.
FP&A analysts are problem-solvers at their core. Whether evaluating budgets or forecasting market trends, strong analytical abilities are essential for interpreting complex financial data and turning it into actionable insights. At Tesla, the FP&A team relied on these skills to:
Analytical skills empower FP&A analysts to connect the dots and anticipate outcomes, ensuring that leadership can make informed decisions in a fast-paced environment.
Excel is the cornerstone of an FP&A analyst’s toolkit. It’s the go-to platform for budgeting, forecasting, and building financial models. At Tesla, Excel likely played a central role in managing budgets and projecting cash flows as the company scaled operations. Advanced proficiency in Excel enables FP&A analysts to:
Mastering these tools allows analysts to work smarter, not harder, and deliver insights quickly and accurately.
Beyond technical analysis, FP&A professionals must communicate insights effectively through structured approaches such as the FRAME Technique. Tesla’s FP&A analysts likely presented their findings to senior leaders, translating raw data into clear, actionable recommendations. Strong communication skills help FP&A analysts:
Presenting financial data to non-financial stakeholders is only part of effective communication. The best FP&A professionals also tell the story behind the numbers, guiding leadership’s decision-making and driving the business forward.
Tesla’s journey from startup to market leader underscores the importance of these core skills for FP&A analysts. Aspiring FP&A professionals can focus on developing these skills to excel in this dynamic field.
Because there are FP&A roles underneath the FP&A manager position, it’s important that anyone interested in becoming an FP&A manager develop their leadership skills.
There are several different FP&A roles within a finance company. These FP&A roles range from entry-level to top-level executives. The hierarchy of standard FP&A job titles from the highest-paying role to the lowest-paying role includes the following:
As the highest-ranking FP&A position, the Director or VP of FP&A typically reports directly to the Chief Financial Officer (CFO). As the highest-ranking FP&A position, the Director or VP of FP&A also supervises all FP&A functions.
Additional duties of the Director or VP of FP&A include developing a top-level strategy for managing corporate finances and reviewing team performance. The Director or VP of FP&A also assesses reports for new growth opportunities and shares insights, recommendations, risks, and rewards with executives and shareholders.
The typical yearly salary for a Director or VP of FP&A is $145,000 to $200,000. Most Directors or VPs of FP&A have 10-15 years of corporate finance experience.
The FP&A manager role is typically the second-highest FP&A position a person can get after the Director or VP of FP&A role. As we’ve already stated, the FP&A manager role is responsible for leading the team of FP&A analysts and Senior FP&A analysts. FP&A managers must also work closely with executives to support important company decision-making. On top of all this, FP&A managers must still create, build, and evaluate budgets, forecasts, and models.
FP&A managers have a typical yearly salary of $70,000 to $150,000. FP&A managers also usually have five to 10 years of corporate finance experience.
While more experienced and developed in their skills than junior-level FP&A analysts, senior FP&A analysts still have a large amount of standard finance work duties. The focus typically just shifts more toward business forecasting, financial modeling, and planning. Senior FP&A analysts even work with the executive team to make recommendations and support decision-making.
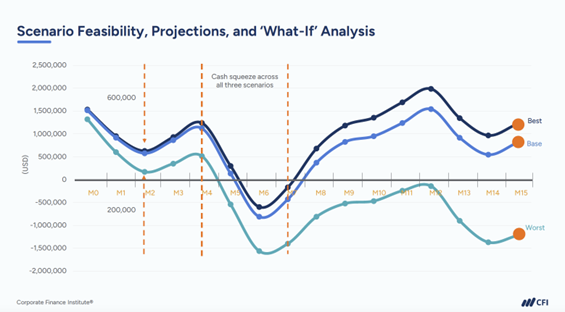
Additional responsibilities of senior FP&A analysts include conducting scenario analysis to decide on future growth plans and forecasts, and building predictive budgets. Senior FP&A analysts must also perform variance analysis on budgets and forecasts to identify areas that need improvement. In addition, Senior FP&A analysts create internal reports for company executives and make recommendations to company employees in leadership.
Senior FP&A analysts make approximately $65,000 to $125,000 a year. Senior FP&A analysts typically have an MBA and three to five years of corporate finance experience.
A regular FP&A analyst is a junior to intermediate-level position. Standard FP&A analysts are responsible for gathering data and building financial models. Regular FP&A analysts are also responsible for tracking, analyzing, and evaluating financial activities and creating monthly reports for department heads.
FP&A analysts also evaluate return on investments and examine ratios such as the debt-to-equity ratio. FP&A analysts also identify cost-cutting opportunities and financial and operational risks.
Entry-level junior FP&A analysts command annual salaries in the neighborhood of $50,000.
If you’re considering FP&A as an entry point, our article on how to become a financial analyst with no experience provides actionable steps to prepare for this role.
Compensation in the financial analysis field varies substantially between different industries and companies. Obviously, larger companies with larger profits can afford to pay more than a smaller company whose total net profit might not even reach seven figures.
Additionally, bonuses are very dependent on the company’s profits and/or the analyst’s skill in making accurate financial forecasts. (Of course, this can potentially lead to problems if an analyst creates overly conservative growth strategies designed primarily to ensure that profit targets are merely hit rather than maximized.)
An FP&A analyst typically spends their day in the following manner:
The day typically begins with analyzing the company’s current financial standing. At Tesla in 2006, as it was gearing up for the launch of its first electric vehicle, the FP&A team had to meticulously monitor budgets and forecasts.
For an FP&A analyst, this might mean:
Tesla’s FP&A team likely worked closely with other departments to ensure every dollar was optimized. Whether it was determining if funds were being allocated efficiently or projecting revenue growth from preorders of the Roadster, the FP&A role demanded a laser focus on detail.
FP&A analysts play a pivotal role in planning for uncertainty. At Tesla, the team would have needed to evaluate scenarios for varying production costs, supplier challenges, or shifts in market demand. Scenario analysis helps companies understand the financial impact of different outcomes and prepare for the unexpected.
For example:
Collaboration is critical here. FP&A analysts might have liaised with supply chain managers, engineers, and external vendors to ensure financial projections aligned with operational realities. Strong communication skills are key — translating complex financial data into actionable insights for senior leaders is a core part of the job.
By the afternoon, it’s time to present findings to key stakeholders. Tesla’s FP&A team likely reported directly to senior leadership, including the CFO. In these meetings, analysts might:
Tesla’s growth relied heavily on such insights. During its early years, every financial decision — from R&D investments to operational expenses — carried significant weight. The ability of FP&A analysts to provide clear, data-driven recommendations would have been pivotal in navigating these challenges.
There’s a fair amount of disagreement about existing exit opportunities within the corporate finance industry. Nonetheless, there are some frequently traveled paths for professionals who have worked in financial planning and analysis.
A majority of corporate financial analysts remain in the industry but pursue new challenges (and higher salaries) by moving from one company to another.
Approximately 10% of corporate financial analysts eventually transition into the fields of either investment banking or private equity. Another 10% move into some other area of corporate management, such as sales and marketing or human resources.
About 20% of financial analysts end up going into business for themselves, becoming private business consultants.
Because the work of corporate financial analysis encompasses such a broad range of activities, and also because the work is so critically important to a company’s growth and basic financial survival, corporate financial planning and analysis (FP&A) is a career path that offers a wide variety of opportunities and higher-than-average compensation. With the proper skill set and a natural inclination for the work, you can carve out a very satisfying career for yourself as a corporate financial analyst.
Corporate FP&A plays a major role in supporting decisions made by a company’s CEO, CFO, and executive leadership team. As such, the opportunity to add value in FP&A is huge, and having a good time in place can lead to a huge potential boost in cash business planning, including budgeting, forecasting, cash flow optimization, return on investment analysis, capital structure, and ultimately the value of the entire business.
The day-to-day role of an FP&A analyst is both challenging and rewarding. It’s about more than crunching numbers in spreadsheets. As an FP&A analyst, you can influence business decisions that shape the future of a company. Whether you’re just starting your career or looking to pivot into FP&A, this field offers endless opportunities to make an impact.
Ready to step into the shoes of an FP&A analyst? CFI’s FP&A Specialization equips you with the skills and knowledge you need to thrive in an FP&A Analyst role.
Explore CFI’s FP&A Specialization today!


