Get Certified for
Business Intelligence (BIDA®)
Develop analytical superpowers by learning how to use programming and data analytics tools such as VBA, Python, Tableau, Power BI, Power Query, and more.
A statistical measure that determines the proportion of variance in the dependent variable that can be explained by the independent variable
R-Squared (R² or the coefficient of determination) is a statistical measure in a regression model that determines the proportion of variance in the dependent variable that can be explained by the independent variable. In other words, R-squared shows how well the data fit the regression model (the goodness of fit).
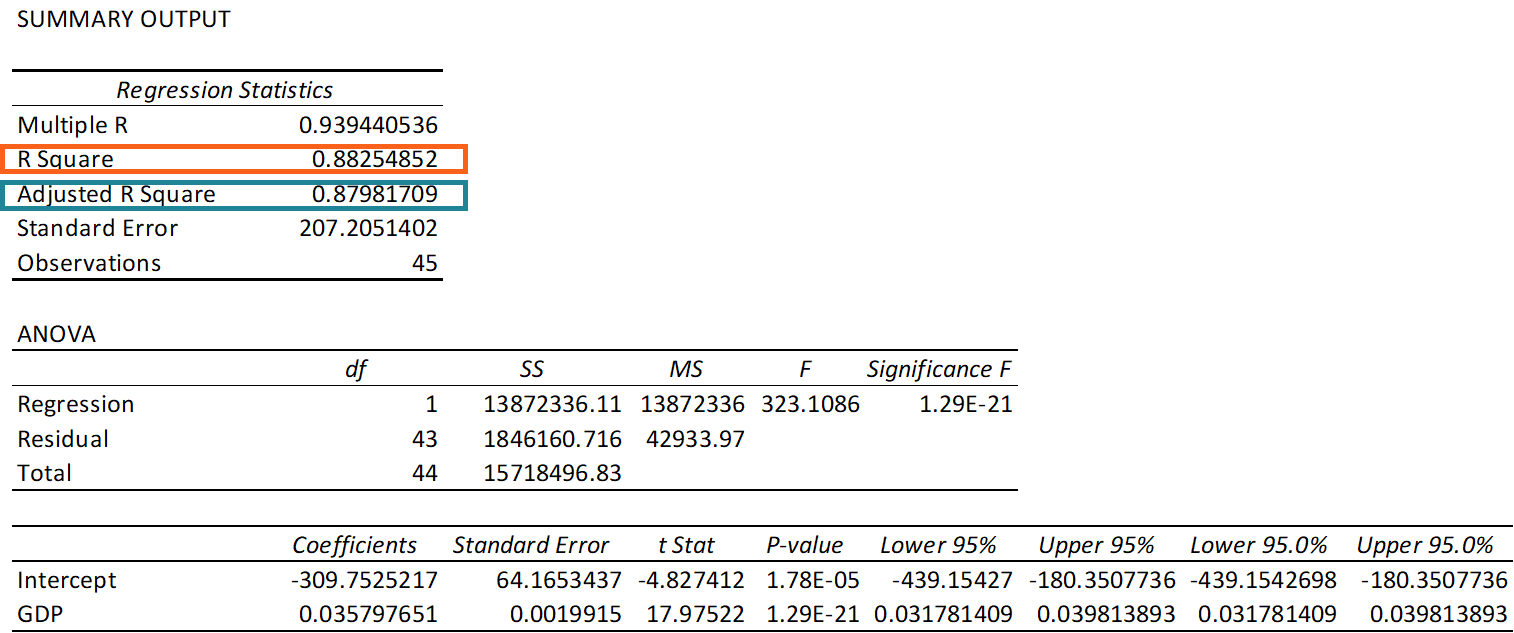
Figure 1. Regression output in MS Excel
R-squared can take any value between 0 and 1. Although the statistical measure provides useful insights into the regression model, the user should not rely solely on it in assessing a statistical model. The figure does not disclose the causal relationship between the independent and dependent variables.
In addition, it does not indicate the correctness of the regression model. Therefore, the user should always draw conclusions about the model by analyzing r-squared alongside the other variables in the statistical model.
The most common interpretation of R-squared is how well the regression model explains observed data. For example, an R-squared of 60% reveals that 60% of the variability observed in the target variable is explained by the regression model. Generally, a higher R-squared indicates that more variability is explained by the model.
However, it is not always the case that a high R-squared is good for the regression model. The quality of the statistical measure depends on many factors, such as the nature of the variables employed in the model, the units of measure of the variables, and the applied data transformation. Thus, sometimes, a high R-squared can indicate problems with the regression model.
A low R-squared figure is generally a bad sign for predictive models. However, in some cases, a good model may show a small value.
There is no universal rule on how to incorporate the statistical measure in assessing a model. The context of the experiment or forecast is extremely important, and, in different scenarios, the insights from the metric can vary.
The formula for calculating R-squared is:
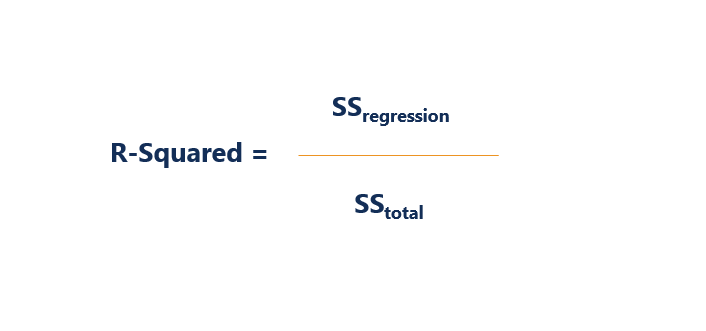
Where:
Although the names “sum of squares due to regression” and “total sum of squares” may seem confusing, the meanings of the variables are straightforward.
The sum of squares due to regression measures how well the regression model represents the data used for modeling. The total sum of squares measures the variation in the observed data (data used in regression modeling).
Connect what you just learned to a clear career path with CFI’s role‑based courses and certification programs.
Thank you for reading CFI’s guide to R-Squared. To keep learning and developing your knowledge of financial analysis, we highly recommend the additional CFI resources below:


