Uniform Distribution

A form of probability distribution where every possible outcome has an equal likelihood of happening

Over 2 million + professionals use CFI to learn accounting, financial analysis, modeling and more. Unlock the essentials of corporate finance with our free resources and get an exclusive sneak peek at the first module of each course. Start Free

What is Uniform Distribution?

In statistics, uniform distribution is a term used to describe a form of probability distribution where every possible outcome has an equal likelihood of happening. The probability is constant since each variable has equal chances of being the outcome.

Uniform Distribution - Examples

Summary

  • In statistics, uniform distribution is a probability distribution where all outcomes are equally likely.
  • Discrete uniform distributions have a finite number of outcomes. A continuous uniform distribution is a statistical distribution with an infinite number of equally likely measurable values.
  • The concepts of discrete uniform distribution and continuous uniform distribution, as well as the random variables they describe, are the foundations of statistical analysis and probability theory.

Examples of Uniform Distribution

Uniform distribution is the simplest statistical distribution. The concept of uniform distribution, as well as the random variables it describes, form the foundation of statistical analysis and probability theory.

For example, if you stand on a street corner and start to randomly hand a $100 bill to any lucky person who walks by, then every passerby would have an equal chance of being handed the money. The percentage of the probability is 1 divided by the total number of outcomes (number of passersby). However, if you favored short people or women, they would have a higher chance of being given the $100 bill than the other passersby. It would not be described as uniform probability.

A deck of cards also has a uniform distribution. It is because an individual has an equal chance of drawing a spade, a heart, a club, or a diamond. Another example of a uniform distribution is when a coin is tossed. The likelihood of getting a tail or head is the same. The graph of a uniform distribution is usually flat, whereby the sides and top are parallel to the x- and y-axes.

Types of Uniform Distribution

Uniform distribution can be grouped into two categories based on the types of possible outcomes.

1. Discrete uniform distribution

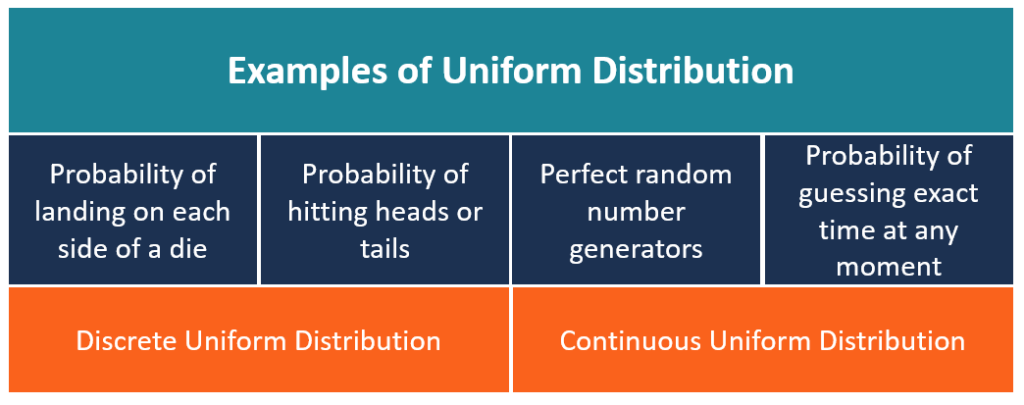
In statistics and probability theory, a discrete uniform distribution is a statistical distribution where the probability of outcomes is equally likely and with finite values. A good example of a discrete uniform distribution would be the possible outcomes of rolling a 6-sided die. The possible values would be 1, 2, 3, 4, 5, or 6. In this case, each of the six numbers has an equal chance of appearing. Therefore, each time the 6-sided die is thrown, each side has a chance of 1/6.

The number of values is finite. It is impossible to get a value of 1.3, 4.2, or 5.7 when rolling a fair die. However, if another die is added and they are both thrown, the distribution that results is no longer uniform because the probability of the sums is not equal. Another simple example is the probability distribution of a coin being flipped. The possible outcomes in such a scenario can only be two. Therefore, the finite value is 2.

There are several ways in which discrete uniform distribution can be valuable for businesses. For example, it can arise in inventory management in the study of the frequency of inventory sales. It can provide a probability distribution that can guide the business on how to properly allocate the inventory for the best use of square footage.

Discrete uniform distribution is also useful in Monte Carlo simulation. This is a modeling technique that uses programmed technology to identify the probabilities of different outcomes. Monte Carlo simulation is often used to forecast scenarios and help in the identification of risks.

2. Continuous uniform distribution

Not all uniform distributions are discrete; some are continuous. A continuous uniform distribution (also referred to as rectangular distribution) is a statistical distribution with an infinite number of equally likely measurable values. Unlike discrete random variables, a continuous random variable can take any real value within a specified range.

A continuous uniform distribution usually comes in a rectangular shape. A good example of a continuous uniform distribution is an idealized random number generator. With continuous uniform distribution, just like discrete uniform distribution, every variable has an equal chance of happening. However, there is an infinite number of points that can exist.

More Resources

To keep advancing your career, the additional CFI resources below will be useful:

0 search results for ‘