Get Certified for
Capital Markets (CMSA®)
From equities and fixed income to derivatives, the CMSA certification bridges the gap from where you are now to where you want to be — a world-class capital markets analyst.
The graphical representation of the relationship between the price of forward contracts and the time to maturity of the contracts
The forward curve or the future curve is the graphical representation of the relationship between the price of forward contracts and the time to maturity of the contracts. The vertical axis measures the price of a forward contract, and the horizontal axis measures the time to maturity of that forward contract.
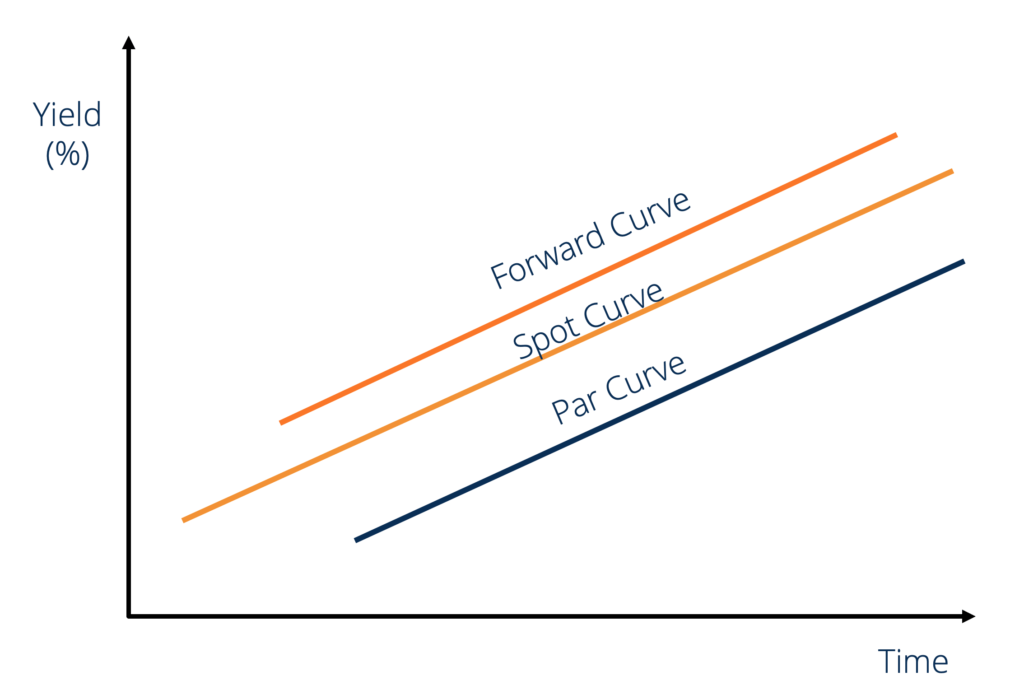
The forward curve is static in nature and represents the relationship between the price of a forward contract and the time to maturity of that forward contract at a specific point of time. When the spot curve is upward sloping, the forward curve will be above it, and the par curve will be below it. The image bellow illustrates this.
A forward contract is a commitment to sell or purchase goods for a specified price at a future date. A forward contract comprises two main components:
Standardized forward contracts are for pre-determined amounts and only specify the term length. For example, a standard 1oz forward contract for gold with a delivery date of January 31, 2019 guarantees its holder 1oz of gold on January 31, 2019. Similarly, a {October 31, 2019, 1oz-silver} contract guarantees its holder 1oz of silver on October 31, 2019.
The normal forward curve is the graphical representation of the positive relationship between the price of a forward contract and the time to maturity of that forward contract. The normal forward curve is a positively sloped curve in time-price space. A normal forward contract is associated with positive net carry costs.
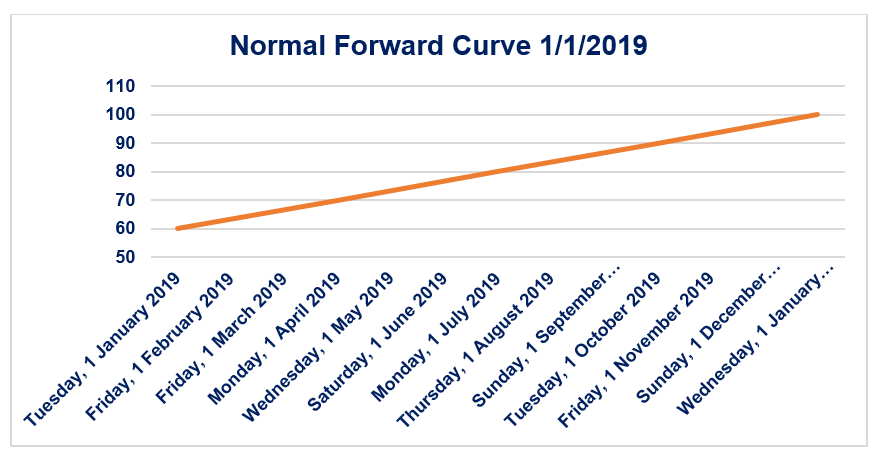
Consider the forward curve shown above. Let us assume that it is the forward curve of a standard silver forward contract. Therefore, the price on January 1, 2019 of a {January 1, 2019, 1oz-silver} contract is $60. It is the spot price of silver in the market.
Similarly, the price on January 1, 2019 of a {April 1, 2019, 1oz-silver} contract is $70. If the market for forward contracts is efficient (i.e., there is no scope for arbitrage), then the 3-month net carry cost between January 1, 2019 and April 1, 2019 for 1oz of silver is $10 (i.e., it would cost an investor $10 to store 1oz of silver for the period January 1, 2019-April 1, 2019).
The inverted forward curve is the graphical representation of the negative relationship between the price of a forward contract and the time to maturity of that forward contract. The inverted forward curve is a negatively sloped curve in time-price space. An inverted forward curve is associated with negative net carry costs.
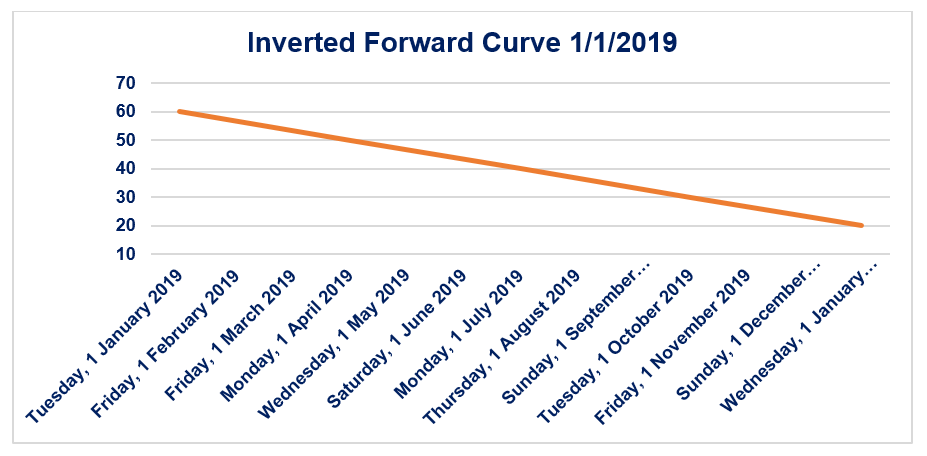
Consider the forward curve shown above. Let us assume that this is the forward curve of a standard silver forward contract. Therefore, the price on January 1, 2019 of a {January 1, 2019, 1oz-silver} contract is $60. It is the spot price of silver in the market.
Similarly, the price on January 1, 2019 of a {April 1, 2019, 1oz-silver} contract is $50. If the market for forward contracts is efficient (i.e., there is no scope for arbitrage), then the 3-month net carry cost between January 1, 2019 and April 1, 2019 for 1oz of silver is -$10 (i.e., it would cost an investor -$10 to store 1oz of silver for the period January 1, 2019-April 1, 2019.)
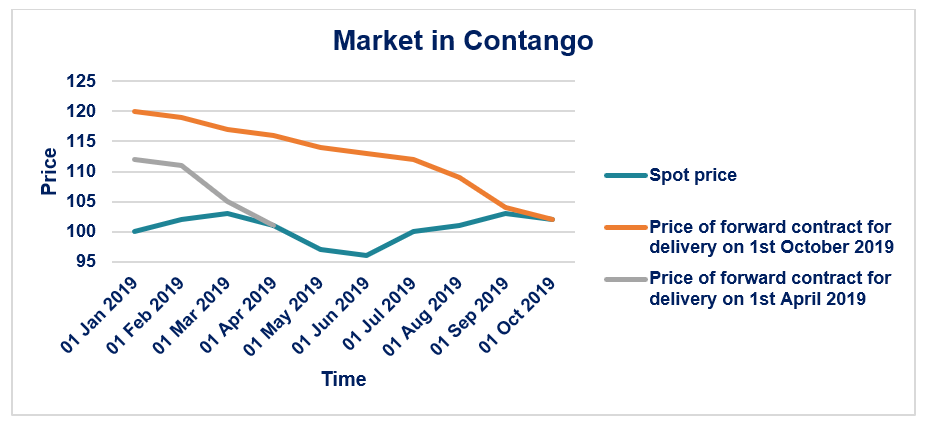
The Contango Theory states that market places a premium on forward contracts over the expected spot price of that commodity on the delivery date. If a {December 31, 2019 1oz-silver} contract is $100, then the expected spot price of 1oz of silver on December 31, 2019 is less than $100. A market is said to be in contango if the forward/future contract price decreases over time to the spot price as it gets closer to the delivery date.
Consider the graph shown below. The spot price of 1oz of silver on January 1, 2019 is $100. The price of a {April 1, 2019, 1oz-silver} contract on January 1, 2019 is $112. As time passes and we get closer and closer to April 1, 2019, the price of a {April 1, 2019, 1oz-silver} contract converges (by decreasing) to the actual price ($101) of 1oz of silver on April 1, 2019.
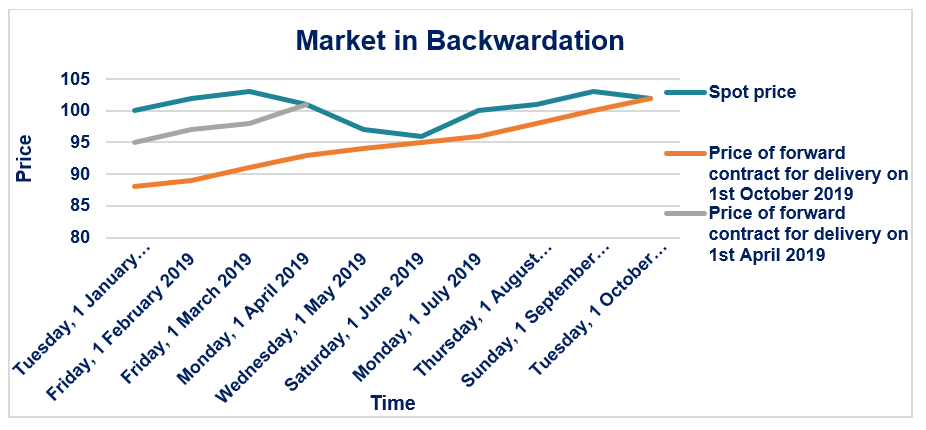
The Backwardation Theory states that market places a negative premium on forward contracts over the expected spot price of that commodity on the delivery date. If a {December 31, 2019 1oz-silver} contract is $100, then the expected spot price of 1oz of silver on December 31, 2019 is more than $100. A market is said to be in backwardation if the forward/future contract price increases over time to the spot price, as it gets closer to the delivery date.
Consider the graph shown below: The spot price of 1oz of silver on January 1, 2019 is $100. The price of a {April 1, 2019, 1oz-silver} contract on January 1, 2019 is $95. As time passes and we get closer and closer to April 1, 2019, the price of a {April 1, 2019, 1oz-silver} contract converges (by increasing) to the actual price ($101) of 1oz of silver on April 1, 2019.
CFI is the official provider of the global Capital Markets & Securities Analyst (CMSA®) certification program, designed to help anyone become a world-class financial analyst. To keep advancing your career, the additional resources below will be useful:


