Get Certified for
Capital Markets (CMSA®)
From equities and fixed income to derivatives, the CMSA certification bridges the gap from where you are now to where you want to be — a world-class capital markets analyst.
An economic theory that describes the relationship between income and food expenditures
Engel’s Law is an economic theory that describes the relationship between household income and a particular good or service expenditures. It states that as family income increases, the percentage of income spent on food decreases. The theory was introduced by Ernst Engel, a German economist and statistician, in 1857. Besides Engel’s Law, he is also famous for the Engel curve in microeconomics.
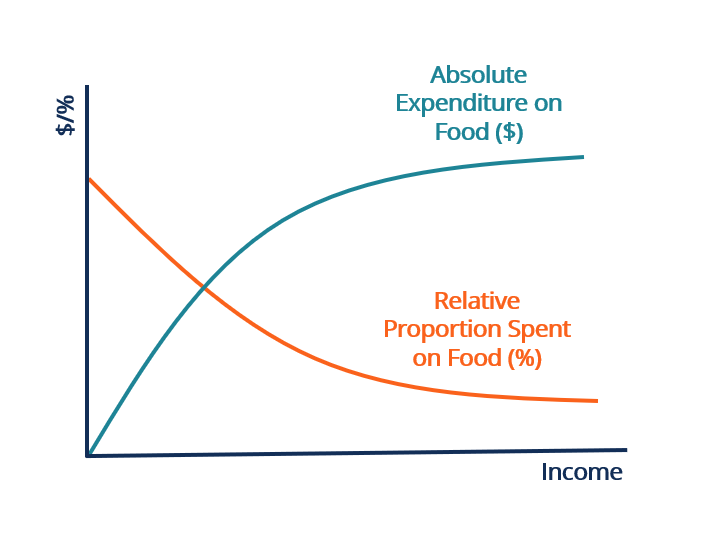
Engel’s Law is an observation in economics. It states that as the income of a family increases, the proportion of income spent on food decreases, although the absolute dollar expenditures on food are still increasing.
Engel’s Law does not assume that the spending on food remains constant as family income increases. For example, a family with a $5,000 monthly income spends $2,000 on food, which makes up 40% ($2,000/$5,000) of its budget. If the income of this family increases by 40% to $7,000, it will spend $2,500 on food.
Although its absolute expenditures on food increase by 25%, the relative proportion to income decreases to 35.7% ($2,500/$7,000). The decrease in proportion can be explained by the lower rate of increase in food expenditures relative to the rate of increase in income.
Engels’ Law implies that the income elasticity of demand for food is positive but less than 1. Income elasticity of demand is a measure of the sensitivity of the quantity of demand for a good to every percentage change in income. It is calculated by dividing the percentage change in the quantity of demand by the percentage change in consumers’ income.
When a family’s income increases, the expenditures on food for that family typically rise as well, which indicates a positive relationship between consumers’ income and the demand for food. It suggests that the income elasticity of food is positive.
However, the increase in food expenditures is slower than the increase in consumers’ income, which leads to a decrease in proportion. Continuing on the above example, a 40% increase in income leads to a 25% increase in food expenditures. Assuming constant unit prices of food, it gives a 0.625 (20%/40%) income elasticity of food. Thus, the demand for food is inelastic relative to income.
Engel’s Law supports that households with lower income spend a larger proportion of their income on food than the ones with a middle- or higher-income level. Food consumption typically makes up a great portion of the budget of a poor family, as the rich tend to spend greater portions of their income on other items, such as entertainment and luxury goods.
The theory can be extended to a country-wide scale and supports that developed countries with higher average household income see a lower proportion of income spent on food – which is measured by the Engel coefficient – than the developing countries with lower income. A country’s Engel coefficient reflects its economic status. A decreasing Engel coefficient usually indicates economic growth with a rising income level in the country. Conversely, an increasing Engel coefficient indicates a drop in a country’s income level.
A derivative concept is the Engel curve, which is based on Engel’s Law. The Engel curve describes how the spending on a certain good varies with household income by either proportion or absolute dollar amount. The shape of an Engel curve is impacted by demographic variables, such as age, gender, and educational level, as well as other consumer characteristics.
The Engel curve also varies for different types of goods. With income level as the x-axis and expenditures as the y-axis, the Engel curves show upward slopes for normal goods, which have a positive income elasticity of demand. Inferior goods with negative income elasticity assume negative slopes for their Engel curves. In the case of food, the Engel curve is concave downward with a positive but decreasing slope.
CFI is the official provider of the global Capital Markets & Securities Analyst (CMSA®) certification program, designed to help anyone become a world-class financial analyst. To keep advancing your career, the additional CFI resources below will be useful:


