Get Certified for
Capital Markets (CMSA®)
From equities and fixed income to derivatives, the CMSA certification bridges the gap from where you are now to where you want to be — a world-class capital markets analyst.
The relationship between tax rates and tax revenues
The Laffer Curve is a theoretical explanation of the relationship between tax rates set by a government and the tax revenue collected at that tax rate. It was introduced by American supply-side economist, Arthur Laffer. The concept was not invented by Laffer; there were other antecedents from the 14th-century writings of Ibn Khaldun.
The Laffer Curve says that there is no tax revenue collection at the two extreme tax rates of 0% and 100%. However, there is one optimal tax rate between both these extremes that maximizes tax revenue collection.
One of the theory’s main assumptions is that if taxation on a certain activity, such as production, is increased beyond a certain point, less of it is produced. Beyond the optimal tax rate, workers start to believe that their extra efforts are resulting in lower additional income. Thus, they work less, income falls, and tax collection decreases.
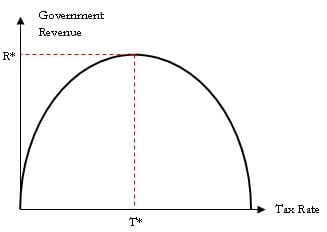
We plot the tax rate on the horizontal axis and the government revenue from taxation on the vertical axis. The curve assumes a parabolic shape. It suggests that at the initial point, the origin when the tax rate is 0%, there is no revenue for the government. As the government increases the tax rate, the revenue also increases until T*. Beyond point T*, if the tax rate is increased, revenue starts to fall. In short, attempts to tax above a certain level are counterproductive and actually result in less total tax revenue.
The taxpayers’ desire to work hard for more income begins to fall because they feel that more of their money is being taken away by the government. At the tax rate of 100%, the tax base of the country will be nil and nobody would work because they will need to give away all their earnings as taxes. T* is the optimal tax rate that a government should aim to achieve.
Laffer brought his concept to the attention of policymakers in 1974 when the general approach of most economists was a Keynesian one. They advocated more government spending to stimulate demand, which in turn meant more taxes. The policy was proving to be ineffective and Laffer asserted that the problem was not because of too little demand but due to the burden of heavy taxes and regulations that left producers without incentive to produce more.
Tax rate cuts affect revenues in two ways. Every tax rate cut translates directly to less government revenue but also puts more money in the hands of taxpayers, increasing their disposable income. In the long term, business activity increases, companies hire more, who in turn spend more, and this leads to economic growth. The growth creates a larger tax base and generates higher total tax revenue.
A higher tax rate increases the burden on taxpayers. In the short term, it may increase revenues by a small amount but carries a larger effect in the long term. It reduces the disposable income of taxpayers, which in turn, reduces their consumption expenditure. Aggregate demand in the economy falls and producers create less. This leads to higher unemployment. The tax base for the government falls and so does its tax revenue.
CFI is the official provider of the global Capital Markets & Securities Analyst (CMSA®) certification program, designed to help anyone become a world-class financial analyst. To continue learning and advance your career, see the following free CFI resources:


