Get Certified for
Capital Markets (CMSA®)
From equities and fixed income to derivatives, the CMSA certification bridges the gap from where you are now to where you want to be — a world-class capital markets analyst.
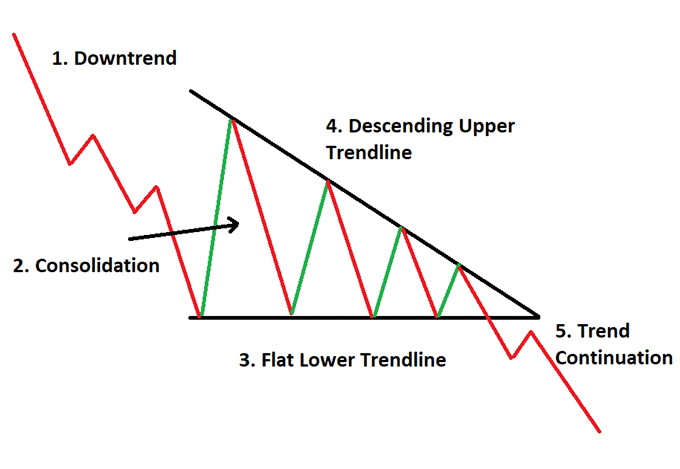
A bearish chart pattern that is characterized by a descending upper trendline and a second, flatter horizontal trendline
A descending triangle refers to a bearish chart pattern used in technical analysis that is characterized by a descending upper trendline and a second, flatter horizontal trendline, which is lower than the first.

Descending triangles, along with terms such as ascending triangles, head-and-shoulders, flag, pennant, and cup-and-handle are all examples of chart patterns, of which there are over 50 types according to noted investor Thomas Bulkowski’s book, “Encyclopedia of Chart Patterns.”
So, what exactly are chart patterns? Chart patterns are frequently used in technical analysis, which is an analysis methodology for securities and helps in the identification of trading opportunities by charting the price trends of past market data. Chart patterns are used specifically by traders and investors to find significant patterns in the prices of publicly traded assets such as stocks or bonds.
Patterns exist in every market throughout every time period and are heavily scrutinized because patterns in certain markets often show a high positive expectancy rate or have predictive value. As such, many investors and traders know that being able to identify patterns and the psychology behind a particular pattern is crucial to taking advantage of the pattern.
Descending triangles are composed of two trendlines – one descending trendline and one horizontal trendline. An easy way of visualizing descending triangles without an actual image can be done via the phrase “flat bottoms, falling tops.”
Descending triangles indicate to investors and traders that sellers are more aggressive than buyers as the price continues to make lower highs. It is a very popular chart pattern because it clearly shows that the demand for an asset or commodity is weakening. The pattern completes itself when the price breaks out of the triangle in the direction of the overall trend, usually below the lower support, which indicates that the downside momentum in place is likely to continue or become stronger, making a breakdown imminent.
Once the breakdown occurs, technical traders are able to aggressively push the price of the asset even lower and make significant profits over a brief period.
Descending triangles come with several notable features that can be used by traders and investors to easily identify them. The features usually apply to both financial markets and foreign exchange markets.
Descending triangle patterns offer many advantages, such as being easily identifiable and produces a clear target level, which is based on the maximum height of the triangle. However, one major disadvantage of using descending triangles is that there is always the potential for a false breakdown, which is where the down trend reverses pattern.
Also, there is always the possibility that prices move sideways or higher for lengthy periods of time, acting contrary to the usual features of descending triangles. In some situations, trend lines may need to be redrawn as the prices break out in the opposite direction than the one that was expected.
CFI is the official provider of the global Capital Markets & Securities Analyst (CMSA)® certification program, designed to help anyone become a world-class financial analyst. To keep advancing your career, the additional resources below will be useful:


