Get Certified for
Capital Markets (CMSA®)
From equities and fixed income to derivatives, the CMSA certification bridges the gap from where you are now to where you want to be — a world-class capital markets analyst.
A bar pattern that predicts a loss of momentum in the direction of the trend
A hook reversal refers to a candlestick pattern that lasts for a short time and predicts a reversal in a market trend. The hook reversal is a specific form of the inside day that shows trend evidence during an uptrend or downtrend.

In both trends, the pattern occurs when the candlestick has a lower high and a higher low. What makes the patterns in a hook reversal stand out from other forms of patterns is the relatively small size difference between the body of the first and second bars.
Hook reversals occur frequently, and proper color coding of their patterns makes them easy to spot; hence, their popularity among active traders. The strength of the preceding uptrend or downtrend of a hook reversal pattern is often used to determine the strength and reliability of hook reversal.
In order to confirm a reversal, most traders use technical patterns or other candlestick patterns, such as charts. Of all the reversal signs, hook reversal occurs frequently, resulting in numerous false positives that must be discounted. Some market observers consider hook reversal a benign pause in the trend, as buyers consolidate the preceding trending move.
The hook reversal pattern is charted as a candlestick, followed by a small body that overlaps and is contained within the vertical range of the body of the previous day’s candlestick. Because of the appearance of predicting a trend, the hook reversal is often classified as a type of engulfing pattern.
Hook reversal patterns are also similar to the patterns of the dark cloud cover, where the lengths of the real bodies are similar. Nevertheless, hook reversal patterns and the other types of patterns have a key difference between them.
For hook reversal patterns, a small size difference is required in sizes between candlesticks, whereas the other patterns emphasize the large size between candlesticks. Engulfing and harami are among the less common patterns that are more accurate in predicting a trend reversal compared to hook reversal patterns.
Bearish hook reversal patterns occur in an uptrend, where they have a lower high and a higher low on the day of the signal. The body of the candlestick will have an open near the high and a close near the low. The pattern is an illustration of a consistent upward trend in the market.
After buyers open the market within the range of the previous day, they may either start taking profits, which turns down the price, or bid the price a little higher before taking profits. Potential sellers will then be forced to start selling because the trend failed to make a new high. Eventually, sellers dominate the market gradually but with great conviction so that they close near the low.
Since the low is higher than the previous, sellers complete an inside day. Buyers’ commitment has waned, and sellers have commandeered the market. Clearly, bulls have taken over driving the market early on before bears regain control to lower the prices.
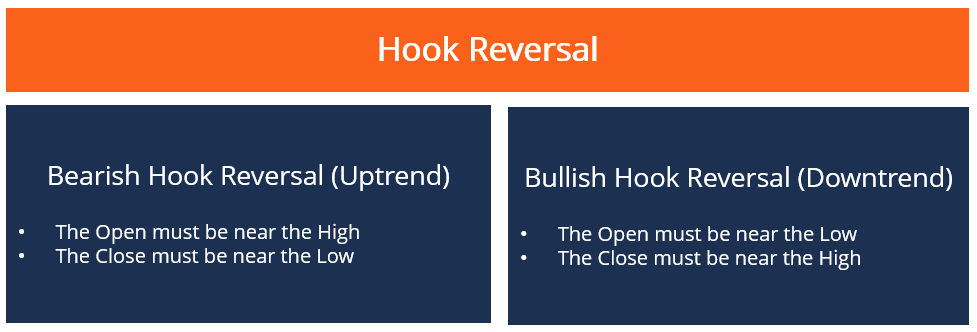
Bullish hook reversal patterns occur in a downtrend. As with the upward trend, hook reversal patterns will have a lower high and a higher low on the day of the signal in a downward trend. The body of the candlestick will have an open near the low and a close near the high.
It illustrates a consistent downward trend in the market. Sellers open the market with the previous day’s range. Thereafter, either short-sellers may start buying back their open positions, which turns the price up, or bargain hunters may start purchasing, bidding the price higher.
Buyers who have been waiting for lower prices will be forced to start buying because the trend failed to make a new high. They will then take over, driving the market gradually, but without great conviction so that the day closes near the high.
Since the high is lower than the previous high, the trend completes an inside day. Bears are in control of the market early on before the bulls take over, driving the market and raising the price higher.
Consider Company X, whose price starts trending up continuously for the first three days before down-trending for the next two in five days. On the second day, the company opens the market with a high that is lower than the previous day and immediately trades down. On the third day, it closes on its low, but above the previous low.
The pattern above completes a hook reversal, which is a strong reversal since the company opened on its high and closed on its low. Additionally, the company reported a significant range, suggesting clearly that buyers received ample time to take over the market from buyers before a new upswing starts.
CFI offers the Capital Markets & Securities Analyst (CMSA)™ certification program for those looking to take their careers to the next level. To keep learning and advancing your career, the following resources will be helpful:


