AVERAGEIFS Function
Calculates the average of all numbers in a given cell range based on multiple criteria
What is the AVERAGEIFS Function?
The AVERAGEIFS Function[1] is an Excel Statistical function that calculates the average of all numbers in a given range of cells, based on multiple criteria. The function was introduced in Excel 2007. This guide will demonstrate how to calculate the average with multiple criteria in Excel.
Formula
=AVERAGEIFS(average_range, criteria_range1, criteria1, [criteria_range2, criteria2], …)
The AVERAGEIFS function includes the following arguments:
- Average_range (required argument) – This is one or more cells that we wish to average. The argument includes numbers or names, arrays, or references that contain numbers.
- Criteria_range1, criteria_range2 range (required argument) – Criteria_range1 is a required argument. However, subsequent criteria_ranges are optional arguments. There can be up to 127 ranges and associated criteria.
- Criteria1, criteria2, … – Criteria1 is a required argument. However, subsequent criteria are optional. There can be from 1 to 127 criteria in the form of a number, expression, cell reference, or text that define which cells will be averaged. For example, criteria can be expressed as 12, “12”, “>12”, “Cornflakes”, or A4.
How to use the AVERAGEIFS Function in Excel?
To understand the uses of this function, let’s consider a few examples of how to calculate the average with multiple criteria:
Example 1
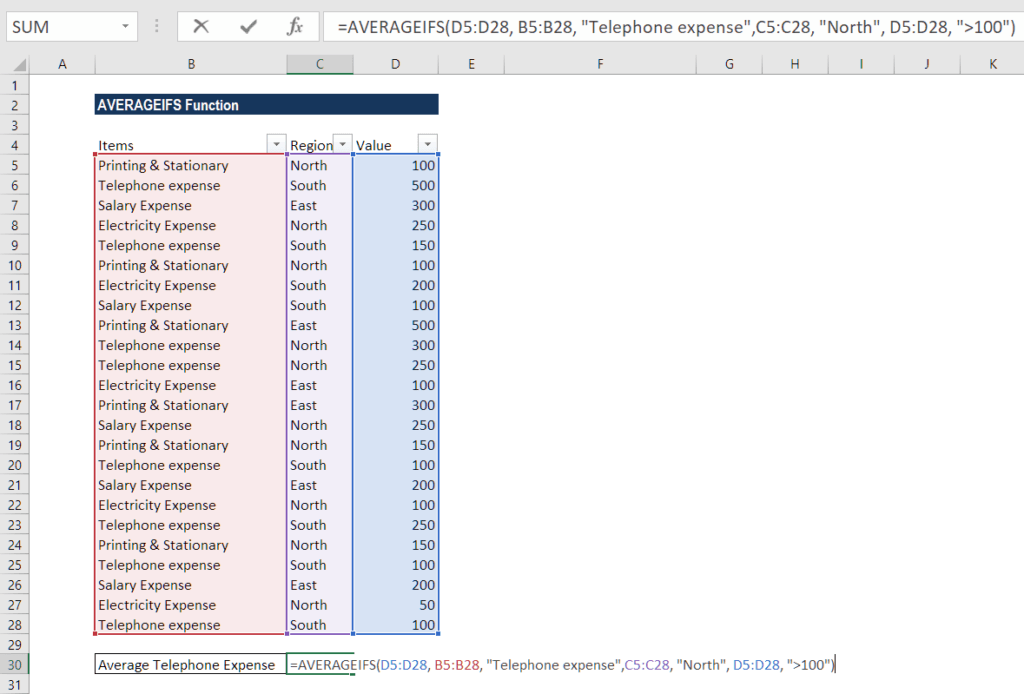
Let’s assume we wish to know the average telephone expenses for the North region that are greater than 100. We are given a list of expenses in column A and the amounts in column B. The formula to be used is below:
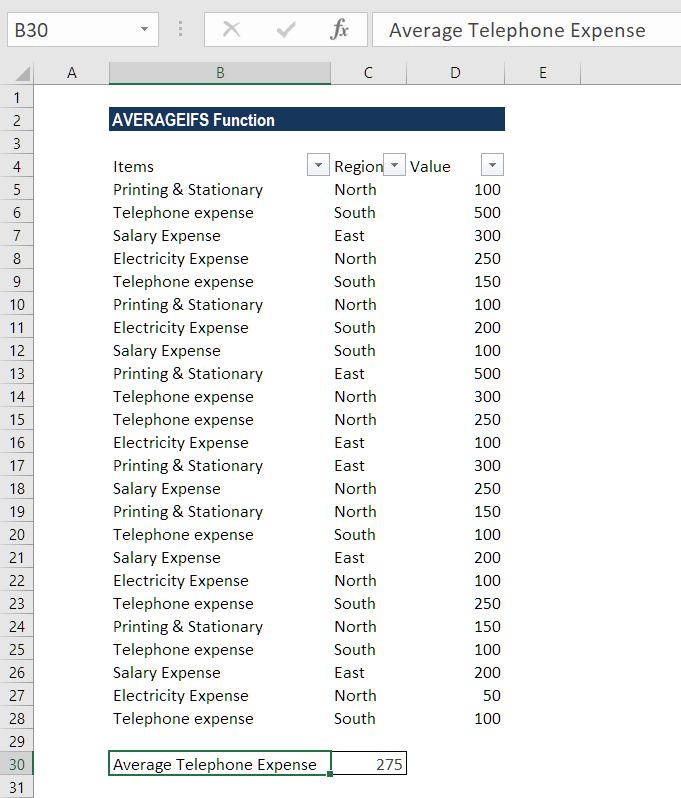
We get the result below:
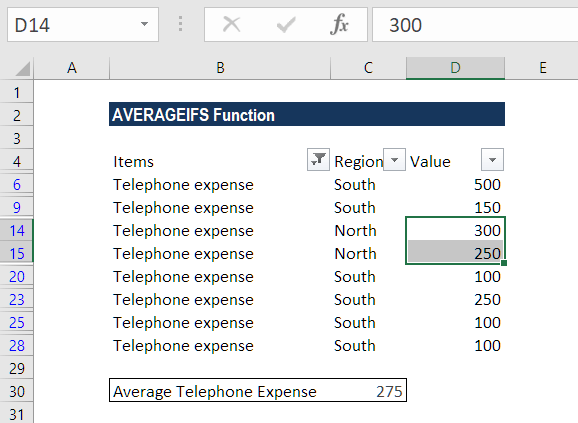
As we can see, only two cells (B11 and B12) meet all conditions, and therefore, only these cells are averaged.
In criteria1, we entered the Telephone expense. In criteria 2, we used North and asked the function to average cells greater than 100.
Example 2
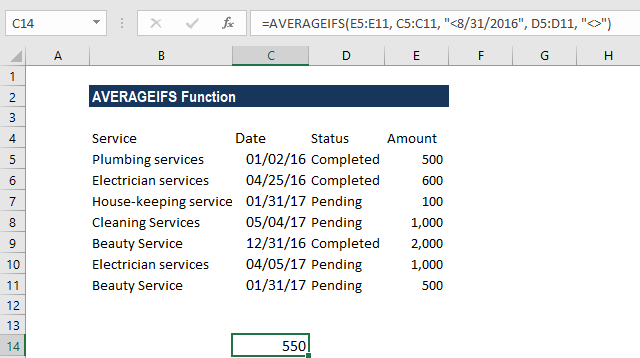
In this example, let’s find the average of services completed before August 31, 2016, whose status is defined. We listed the service type in Column A, date in column B, status in column C, and the amount received in column D. The formula is as follows:
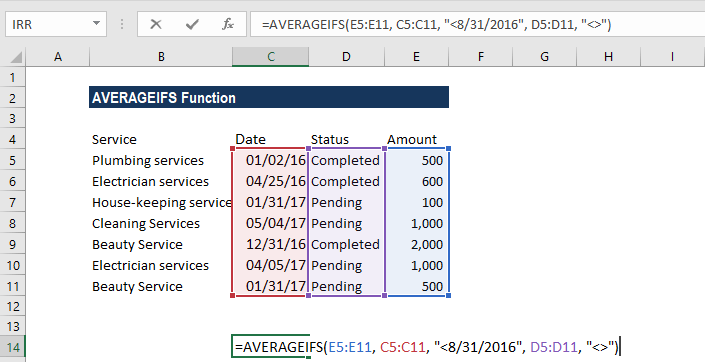
Here, we entered in criteria 1 a date preceded with a comparison operator. Whereas, in criteria 2, we typed “<>”. It would tell the formula to include only non-empty cells within citeria_range2, that is, column C in our example. We get the result below:
A few notes about the AVERAGEIFS Function
- #DIV0! error – We will get this error when:
- Argument average_range is left blank or is a text value.
- Cells in average_range cannot be translated into numbers.
- All the criteria are not met.
- When any cell in criteria range is empty, this function treats it as 0 (zero) value.
- In AVERAGEIFS, each criteria_range must be the same size and shape as sum_range.
- We can use wildcard characters such as question mark (?) and asterisk (*) in this function as criteria. A question mark matches any single character; an asterisk matches any sequence of characters. If we wish to find an actual question mark or asterisk, we need to type a tilde (~) before the character.
- When we use a number or date in conjunction with a logical operator in AVERAGEIFS’ criteria, we should enclose this combination in double quotes like “<8/21/2017”.
- When all the corresponding criteria specified are true for a particular cell only, the average calculation is used for that cell in average_range.
- The AVERAGEIFS function evaluates cells in a range that contains TRUE as 1; cells in a range that contains FALSE are evaluated as 0 (zero).
Click here to download the sample Excel file
Additional Resources
Thanks for reading CFI’s guide to important Excel functions! By taking the time to learn and master these functions, you’ll significantly speed up your financial analysis. To learn more, check out these additional CFI resources:
- Excel Functions for Finance
- Advanced Excel Formulas You Must Know
- Excel Shortcuts for PC and Mac
- AVERAGEIF Function
- PV Function
- See all Excel resources
Article Sources
Excel Tutorial
To master the art of Excel, check out CFI’s Excel Crash Course, which teaches you how to become an Excel power user. Learn the most important formulas, functions, and shortcuts to become confident in your financial analysis.

Launch CFI’s Excel Crash Course now to take your career to the next level and move up the ladder!


