CHISQ.DIST Function

Returns the chi-square distribution

Over 2 million + professionals use CFI to learn accounting, financial analysis, modeling and more. Unlock the essentials of corporate finance with our free resources and get an exclusive sneak peek at the first module of each course. Start Free

Chi Square Test Excel Function

The CHISQ.DIST Function[1] is categorized under Excel Statistical functions. It will return the chi-square distribution. The distribution is commonly used for studying the variations in percentage across samples. This guide will break down the Chi Square Test Excel function in detail.

In financial analysis, this function can be useful in finding out the variations in an individual’s assumptions. For example, assume we operate a company manufacturing jeans. We manufacture jeans of two colors only – black and blue. If we want to find out the proportion of blue jeans sold in proportion to the total number of jeans manufactured, we can use Chi Square in Excel to find out.

The CHISQ.DIST function was introduced in MS Excel 2010 and hence is unavailable in earlier versions.

Chi Square Excel Formula

=CHISQ.DIST(x,deg_freedom,cumulative)

The CHISQ.DIST uses the following arguments:

  1. X (required argument) – This is the value at which the chi-square distribution is to be evaluated. It should be greater than or equal to zero.
  2. Deg_freedom (required argument) – This is the number of degrees of freedom. It must be an integer between 1 and 1010.
  3. Cumulative (required argument) – This is a logical value that determines the form of the function. It can either be TRUE (use the cumulative distribution function) or FALSE (will use the probability density function).


How to use the Chi Square function        

To understand the uses of the Chi Square in Excel function, let’s consider an example:

Example

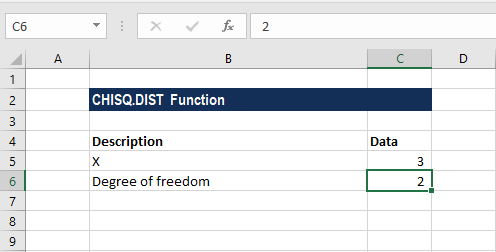
Suppose we are given the following data:

Chi Square Test Excel function - setup

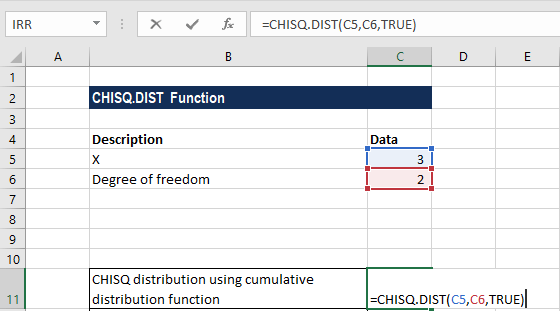
The formula for calculating the CHISQ distribution using the cumulative distribution function is shown below:

CHISQ.DIST - Example 1

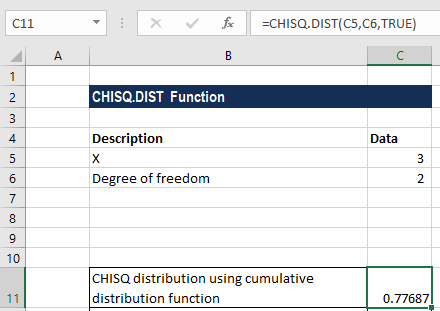
We get the result below:

Chi Square Test Excel function - example

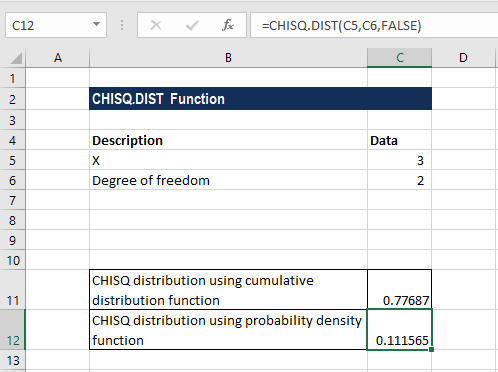
The formula for calculating the CHISQ distribution using the probability density function is shown below:

CHISQ.DIST - Example 1b

We get the result below:

Chi Square in Excel - Example

Notes about the Chi Square Excel function

  1. If the deg_freedom argument is not an integer, it is truncated by MS Excel.
  2. #VALUE! error – Occurs when any of the arguments provided are non-numeric.
  3. #NUM! error – Occurs when:
    1. The given value of x is negative.
    2. The deg_freedom argument is less than 1 or greater than 1010.

Additional Resources

Thanks for reading CFI’s guide to the Chi Square Test Excel function! By taking the time to learn and master these functions, you’ll significantly speed up your financial analysis. To learn more, check out these additional CFI resources:

Article Sources

  1. CHISQ.DIST Function

Excel Tutorial

To master the art of Excel, check out CFI’s Excel Crash Course, which teaches you how to become an Excel power user.  Learn the most important formulas, functions, and shortcuts to become confident in your financial analysis.

Launch CFI’s Excel Course now

to take your career to the next level and move up the ladder!

0 search results for ‘