COVARIANCE.S Function
Calculates the sample covariance for two sets of values
What is the COVARIANCE.S Function?
The COVARIANCE.S Function[1] is categorized under Excel Statistical functions. It will calculate the sample covariance for two sets of values provided by a user.
As a financial modeling analyst, the COVARIANCE.S function is very useful when we want to find the extent to which two assets move in tandem – for example, if we wish to find the relationship between the movement of Bitcoin vis-a-vis Ethereum. If we get a positive covariance, it means they move together. A negative covariance means they tend to move in opposite directions.
The function is quite useful if our investment capital is limited and we are risk-averse. One example is when we’ve shortlisted three stocks but can only afford to invest in two of them. The covariance between the three stocks is as follows:
- Stock M and Stock N = –100
- Stock M and Stock P = 100
- Stock N and Stock P = 0
If we are solely looking at the returns, we will choose stocks M and P, as they show the highest potential returns. However, they also show the highest potential loss, too. If we are risk-averse, we would choose stocks M and N to diversify the amount of risk away by virtue of the fact that they evidence a negative covariance. Therefore, a price decline in one of those stocks should be mitigated by gains in the other stock.
Covarience Formula
=COVARIANCE.S(array1, array2)
The function uses the following arguments:
- Array1 (required argument) – This is the first array of numeric values.
- Array2 (required argument) – This is the second array of numeric values.
The arguments can be either numbers or names, arrays, or references that contain numbers.
How to use COVARIANCE.S Function in Excel?
The COVARIANCE function was introduced in Excel 2010 and is available in all subsequent Excel versions. To understand the uses of this function, let’s look at an example:
Covariance Example
Suppose we are given data about the weekly returns of Stock A and percentage of change in the market index (NASDAQ):
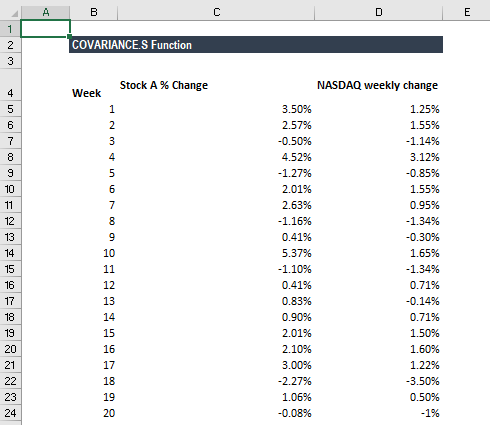
Let’s use the function to understand if there is any covariance between the stock returns and NASDAQ returns.
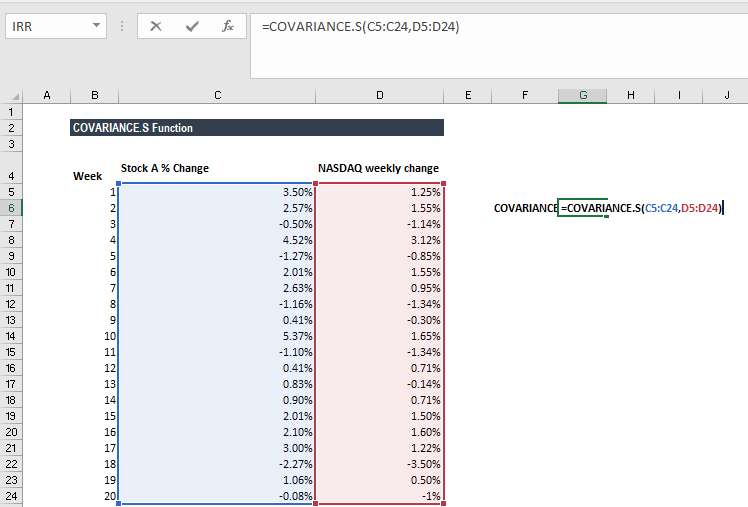
We get the result below:
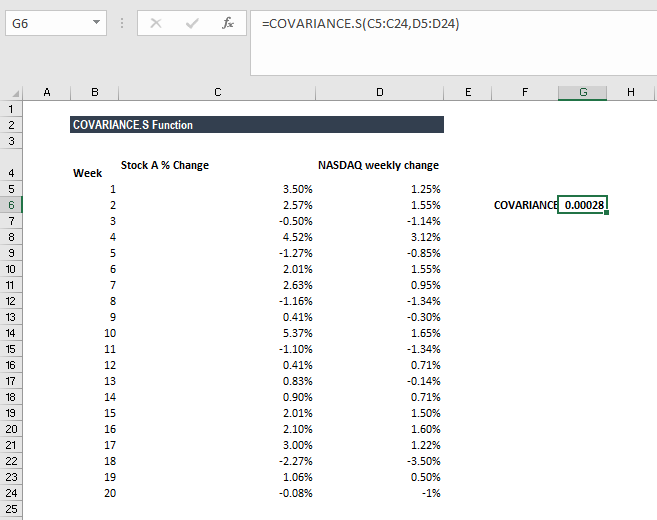
The result indicates that there exists a positive correlation between the two.
A few notes about the COVARIANCE.S Function
- #N/A error – This occurs if the given arrays, that is array 1 and array 2, are different in length.
- #VALUE! error – Occurs if either of the given arrays is empty.
- #DIV/0! error – Occurs if any of the arrays, that is, either array 1 or array 2, is empty or contains only one data point.
- If an array or reference argument contains text, logical values, or empty cells, the values are ignored; however, cells with the value zero are included.
Click here to download the sample Excel file
Additional Resources
Thanks for reading CFI’s guide to the Excel COVARIANCE.S function. By taking the time to learn and master these functions, you’ll significantly speed up your financial analysis. To learn more, check out these additional CFI resources:
- Excel Functions for Finance
- Advanced Excel Formulas You Must Know
- Excel Shortcuts for PC and Mac
- F.TEST Function
- See all Excel resources
Article Sources
Excel Tutorial
To master the art of Excel, check out CFI’s Excel Crash Course, which teaches you how to become an Excel power user. Learn the most important formulas, functions, and shortcuts to become confident in your financial analysis.

Launch CFI’s Excel Crash Course now to take your career to the next level and move up the ladder!


