DSUM Function
Calculates the sum of a specific field/column in a database for selected records based on user-specified criteria
What is the DSUM Function?
The DSUM Function[1] is categorized under Excel Database functions. The function helps to calculate the sum of a specific field/column in a database for selected records based on user-specified criteria. DSUM was introduced in MS Excel 2000.
As a financial analyst, if we need to find out the total number of records where the order number is greater than 100 and the quantity is greater than or equal to 10, DSUM will help us calculate the sum of such orders.
Formula
=DSUM(database, field, criteria)
The DSUM function uses the following arguments:
- Database (required argument) – This is the range of cells wherein the first row of the database specifies the field names.
- Field (required argument) – This is the column within the database that will be summed. Field can be a field name that is the header provided at the top row such as “Area,” “Sales,” etc. or it can be a number.
- Criteria (required argument) – This is a range of cells that contains the criteria specified by us. It specifies the record that will be included in the calculation. We can use any range for the criteria argument, as long as it includes at least one column label and at least one cell below the column label in which the condition for the column is specified.
How to use the DSUM Function in Excel?
To understand the uses of the DSUM function, let’s consider a few examples:
Example 1
Suppose we are given the data below:
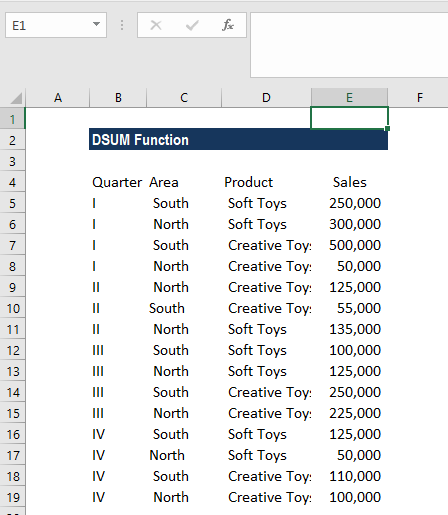
We will use the DSUM function to calculate the total sales of soft toys in quarters 3 and 4. The criteria specified are:
- Quarter: >II
- Product: Soft toys
As shown below, the formula we used was =DSUM(B4:E19,”Sales”,H5:I6).
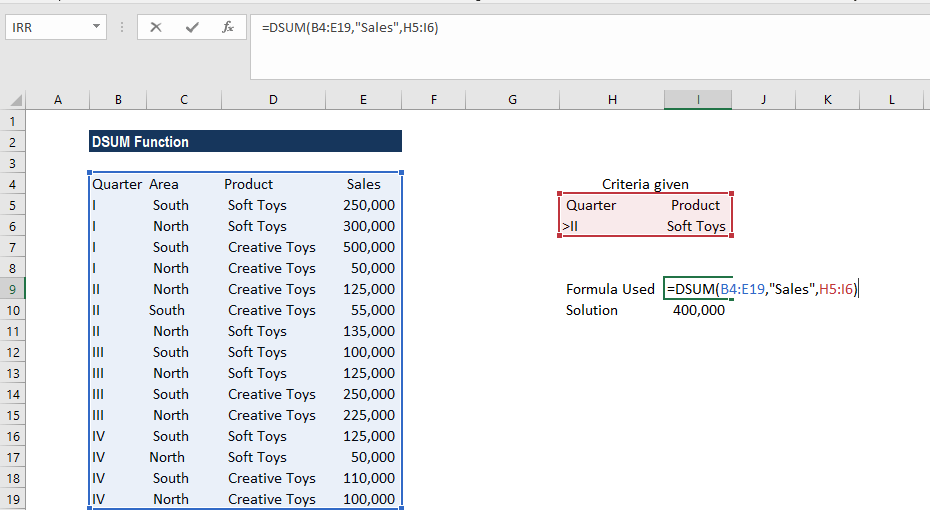
We get 400,000 as the result.
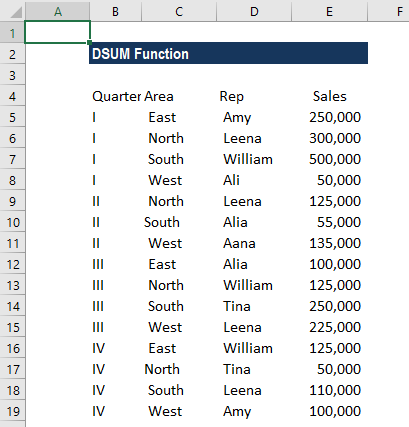
Example 2
Suppose we are given the sales data. We wish to find out sales made by all sales reps with names starting with the letter A. Here, we will use A* to find out the figure.
Remember that the Excel database functions allow wildcards to be used in text-related criteria such as ? (matches any single character) and * (matches any sequence of characters).
However, if we wish to find out a “?” or “*” then we will need to type the ~ (tilde) symbol before the character in your search. For example, the condition “m*e” will match all cells containing a text string beginning with “m” and ending in “e.”
We are given the data below:
The criteria specified are:
- Quarter: >II
- Rep: *A
The formula used was:
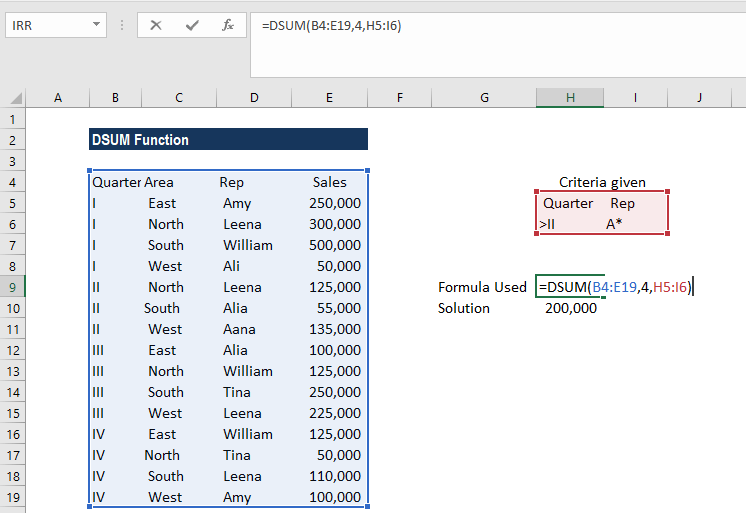
The DSUM function finds out all sales made after Quarter II by reps with names starting with the letter A. The result we get is $200,000.
In the example, instead of typing in “Sales” for the field argument, we simply used the number 4 (to denote the fourth column of the database).
Things to remember about the DSUM Function:
- The criteria range can be located anywhere on the worksheet, but it is advisable to not place the criteria range below the list. If we add more information to the list, the new information is added to the first row below the list. If the row below the list is not blank, MS Excel cannot add the new information.
- We should make sure that the criteria range does not overlap the list.
- If we wish to perform an operation on an entire column in a database, we need to enter a blank line below the column labels in the criteria range.
Click here to download the sample Excel file
Additional Resources
Thanks for reading CFI’s guide to important Excel functions! By taking the time to learn and master these functions, you’ll significantly speed up your financial analysis. To learn more, check out these additional CFI resources:
- Excel Functions for Finance
- Advanced Excel Formulas Course
- Advanced Excel Formulas You Must Know
- DEGREES Function
- SUM Function
- See all Excel resources
Article Sources
Excel Tutorial
To master the art of Excel, check out CFI’s Excel Crash Course, which teaches you how to become an Excel power user. Learn the most important formulas, functions, and shortcuts to become confident in your financial analysis.

Launch CFI’s Excel Crash Course now to take your career to the next level and move up the ladder!


