Get Certified for Financial Modeling (FMVA)®
Gain in-demand industry knowledge and hands-on practice that will help you stand out from the competition and become a world-class financial analyst.
Calculate the inverse of the Cumulative F Distribution for a supplied probability
The F.INV Function[1] is categorized under Excel Statistical functions. It will calculate the inverse of the Cumulative F Distribution for a supplied probability.
As a financial analyst, the function is useful in understanding the variability of two data sets. One example is when we wish to analyze something such as the income diversity between two regions where a company sells its products.
=F.INV(probability,deg_freedom1,deg_freedom2)
The F.INV function uses the following arguments:
If p = F.DIST(x,…), then F.INV(p,…) = x.
Here, we need to remember that the F.INV function is the inverse of the cumulative form of the F.DIST function.
That is, if:
F.DIST(x, deg_freedom1, deg_freedom2, True ) = probability
Then, F.INV(probability, deg_freedom1, deg_freedom2) = x
To learn more, launch our Excel Fundamentals – Formulas for Finance course now!
To understand the uses of the F.INV function, let’s look at an example:
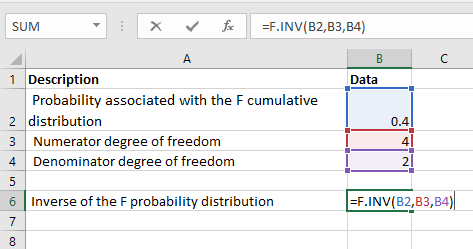
Suppose we are given the data below:
To find out the inverse of the F Probability Distribution using the F.INV function, we will use the following formula:
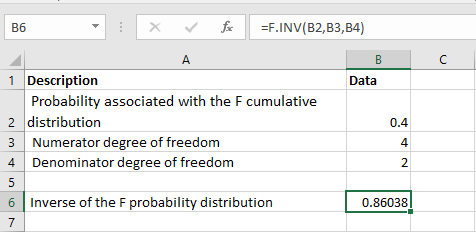
We get the result below:
Thanks for reading CFI’s guide to important Excel functions! By taking the time to learn and master these functions, you’ll significantly speed up your financial modeling and financial analysis. To learn more, check out these additional CFI resources: