TREND Function
Calculate the linear trend line to the arrays of known_y’s and known_x’s
TREND Function – Forecast & Extrapolate in Excel
The TREND Function[1] is an Excel Statistical function that will calculate the linear trend line to the arrays of known y and known x. The function extends a linear trend line to calculate the additional y-values for a new set of x-values. This guide will show you step-by-step how to extrapolate in Excel using this function.
As a financial analyst, the function can help us in predicting future trends. For example, we can use trends to predict the future revenue of a particular company. It is a great forecasting function
Formula
=TREND(known_y’s, [known_x’s], [new_x’s], [const])
The TREND function uses the following arguments:
- Known_y’s (required argument) – This is the set of y-values we already know in the relationship y = mx + b.
- Known_x’s (optional argument) – This is a set of x-values. If we provide the argument, it should be of the same length as the set of known_y’s. If omitted, the set of [known_x’s] takes on the value {1, 2, 3, …}.
- New_x’s (optional argument) – This provides one or more arrays of numeric values that represent the new_x’s value. If the [new_x’s] argument is omitted, it is set to be equal to the [known_x’s].
- Const (optional argument) – This specifies whether to force the constant b to equal 0. If const is TRUE or omitted, b is calculated normally. If false, b is set equal to 0 (zero) and the m-values are adjusted so that y = mx.
The TREND function uses the least squares method to find the line of best fit and then uses IT to calculate the new y-values for the provided new x-values.
How to Use the TREND Function in Excel
To understand the uses of the TREND function, let’s consider an example. Below, we will extrapolate in Excel using the forecast function.
Example – Forecast and Extrapolate in Excel
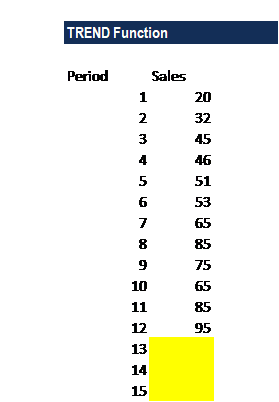
Suppose we wish to build a forecast or extrapolate the future revenue of a company. The data set given is shown below:
To calculate future sales, we will use the TREND function. The formula to use will be:
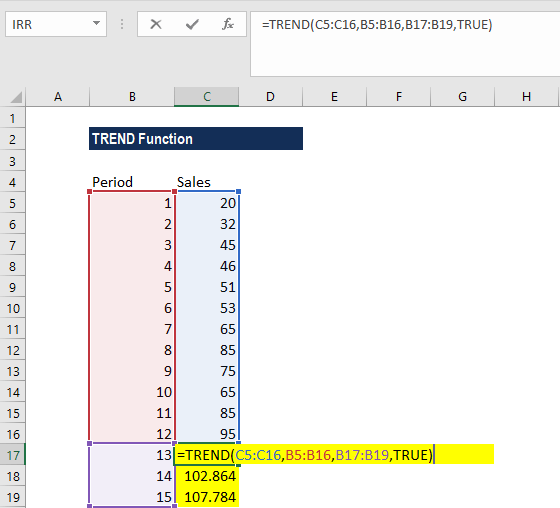
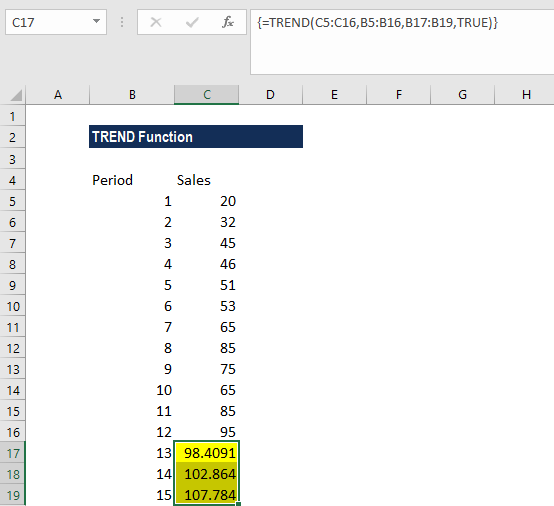
This will return an array of values for y, as the x values to be calculated for are an array of x’s. So, it must be entered as an array formula, by highlighting the cells which need to be filled, input your function into the first cell of the range, and press CTRL-SHIFT-Enter (Same for Mac). We get the result below:
Things to Remember About the TREND Function
- #REF! error – Occurs if the known_x’s array and the new_x’s array are of different lengths.
- #VALUE! error – Occurs when either:
- Non-numeric values provided in the known_y’s, [known_x’s] or [new_x’s]
- The [const] argument provided is not a logical value.
Click here to download the sample Excel file
Connect what you just learned to a clear career path with CFI’s role‑based courses and certification programs.
Additional Resources
Thanks for reading CFI’s guide to the Excel TREND function. By taking the time to learn and master these functions, you’ll significantly speed up your financial modeling in Excel. To learn more, check out these additional CFI resources:
- Advanced Excel Formulas Course
- Advanced Excel Formulas You Must Know
- Excel Shortcuts for PC and Mac
- Become a Certified Financial Analyst
Article Sources
Excel Tutorial
To master the art of Excel, check out CFI’s Excel Crash Course, which teaches you how to become an Excel power user. Learn the most important formulas, functions, and shortcuts to become confident in your financial analysis.

Launch CFI’s Excel Crash Course now to take your career to the next level and move up the ladder!


