MODE.MULT Function
Returns a vertical array of statistical modes within a list of given numbers
What is the MODE.MULT Function?
The MODE.MULT Function[1]is categorized under Excel Statistical functions. It will return a vertical array of statistical modes within a list of given numbers. The function was introduced in MS Excel 2010 and hence is unavailable in earlier versions.
As a financial analyst, MODE.MULT is useful in financial analysis, as it helps find out the most frequently occurring numbers in a given dataset.
Formula
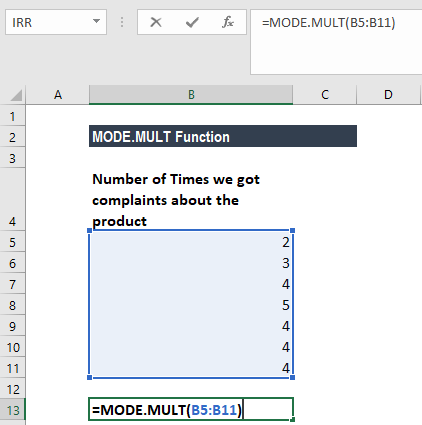
=MODE.MULT((number1,[number2],…)
The MODE.MULT function uses the following arguments:
- Number1 (required argument) – This is the first number for which we want to calculate the mode.
- Number2 (optional argument) – Number arguments between 2 to 254 for which we wish to calculate the mode.
We can use a single array or a reference to an array instead of arguments separated by commas. We need to enter the function as an array formula.
How to use the MODE.MULT Function in Excel?
To understand the uses of the MODE.MULT function, let’s consider a few examples:
Example 1
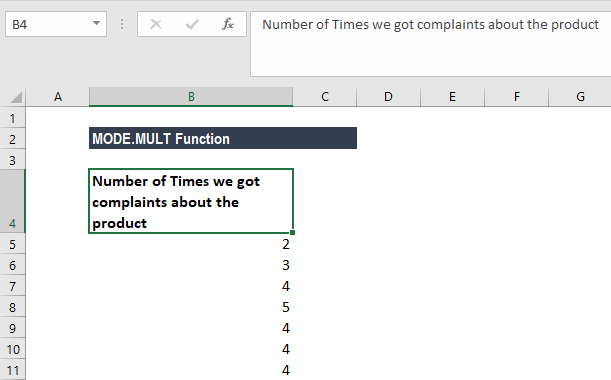
Suppose we are given the following data:
The formula to use is:
We get the result below:
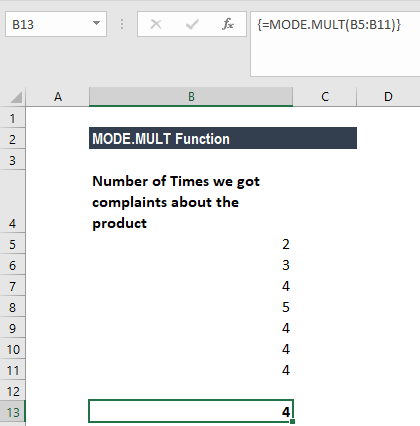
Remember, the MODE.MULT function returns an array of results and must be entered as an array formula. To enter the formula:
- Select a vertical range of cells.
- Enter the MODE.MULT function.
- Confirm with Ctrl + Shift + Enter.
- In each selected cell, MODE.MULTI will return a mode value if one exists.
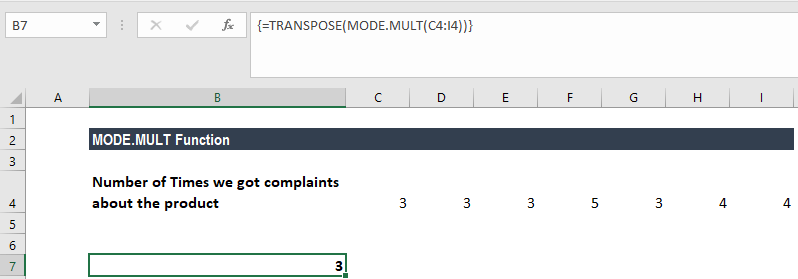
Example 2
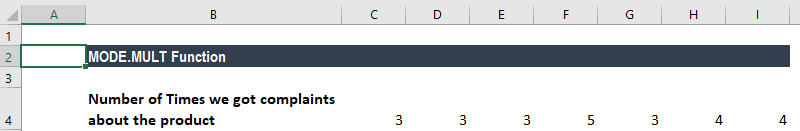
Suppose we are given the following data:
The MODE.MULT function returns results in a vertical array. To return a horizontal array, add the TRANSPOSE function. The formula to use is:
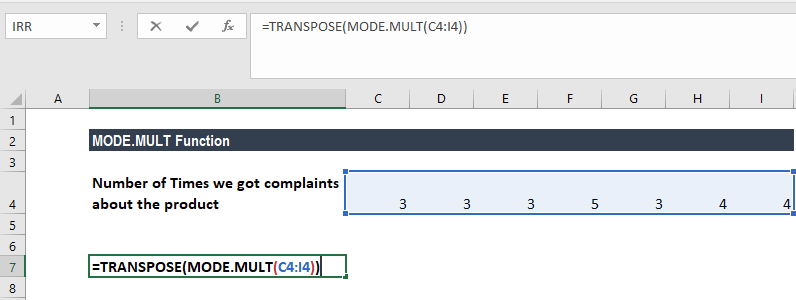
We get the result below:
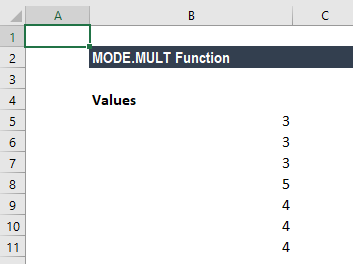
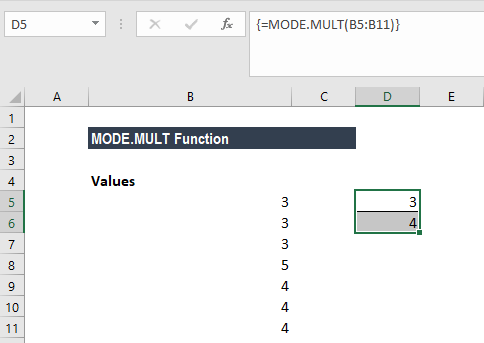
Example 3
The beauty of the MODE.MULT function is that it returns multiple modes if present in the dataset provided. MODE.MULT is different from MODE.SNGL, as the former returns an array of all of the modes, while the latter returns the lowest mode.
Suppose we are given the following data:
We can find the multiple modes in the data set. Here, the MODE.MULT function will return a vertical array containing the two values. It must be entered as an array formula into the vertical range of cells (D5-D6).
The formula to be used in cells D5 and D6 is:
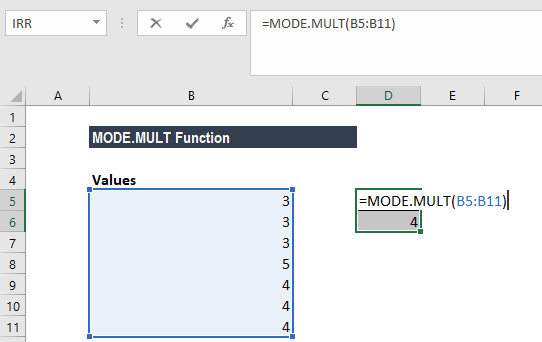
Remember to select both cells while inputting the formula. Otherwise, we will not get accurate results.
We get the result below:
Few notes about the MODE.MULT Function
- #N/A! error – Occurs when there are no duplicates in the values provided.
- #VALUE! Error – Occurs when the value provided to the function is non-numeric.
- Arguments can either be numbers or names, arrays, or references that contain numbers.
- If an array or reference argument contains text, logical values, or empty cells, the values are ignored. However, cells with the value zero are included.
- Arguments that are error values or text that cannot be translated into numbers cause errors.
- If the dataset includes two modes, the MODE.MULT function will return a vertical array containing the two values. It must be entered as an array formula into the vertical range of cells.
Click here to download the sample Excel file
Additional Resources
Thanks for reading CFI’s guide to important Excel functions! By taking the time to learn and master these functions, you’ll significantly speed up your financial analysis. To learn more, check out these additional CFI resources:
- Excel Functions for Finance
- Advanced Excel Formulas You Must Know
- Excel Shortcuts for PC and Mac
- MODE.SNGL Function
- See all Excel resources
Article Sources
Excel Tutorial
To master the art of Excel, check out CFI’s Excel Crash Course, which teaches you how to become an Excel power user. Learn the most important formulas, functions, and shortcuts to become confident in your financial analysis.

Launch CFI’s Excel Crash Course now to take your career to the next level and move up the ladder!


