Over 2 million + professionals use CFI to learn accounting, financial analysis, modeling and more. Unlock the essentials of corporate finance with our free resources and get an exclusive sneak peek at the first chapter of each course.
Start Free
What is the MODE.SNGL Function?
The MODE.SNGL Function[1] is categorized under Excel Statistical functions. It will return the most frequently occurring number in a numeric data set. The function was introduced in MS Excel 2010 and is unavailable in earlier versions.
As a financial analyst, MODE.SNGL can be used to find out the most frequently occurring numbers in a data set. Suppose we wish to know the highest number of sales returns in the first quarter for the last five years, we can use the function to find the figures.
MODE.SNGL is different from MODE.MULT function as the MODE.SNGL function returns the lowest mode, whereas the MODE.MULT function returns an array of all the modes.
Formula
=MODE.SNGL((number1,[number2],…)
The MODE.SNGL function uses the following arguments:
Number1 (required argument) – The first number for which we want to calculate the mode.
Number2 (optional argument) – Number arguments between 2 to 254 for which we wish to calculate the mode.
We can use a single array or a reference to an array instead of arguments separated by commas. The function will return a single numerical value.
How to use the MODE.SNGL Function in Excel?
To understand the uses of the MODE.SNGL function, let’s consider an example:
Example
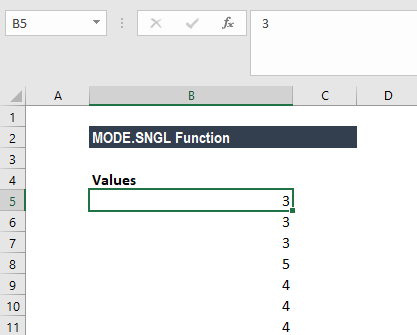
Suppose we are given the following data:
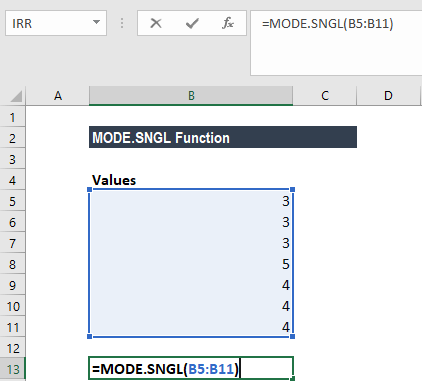
The formula to use is:
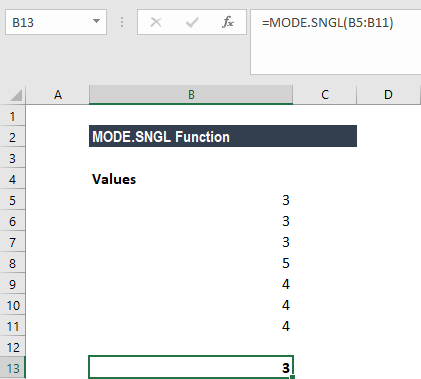
We get the result below:
Remember in the MODE.SNGL function, if there are two or more most frequently occurring values in the supplied data, then it will return the lowest of the values.
A few notes about the MODE.SNGL Function
#N/A! error – Occurs when there are no duplicates in the values provided.
#VALUE! error – Occurs when the value provided to the function is non-numeric. Non-numeric functions that are part of an array of values are ignored by the MODE.SNGL function.
Arguments can either be numbers or names, arrays, or references that contain numbers.
If an array or reference argument contains text, logical values, or empty cells, the values are ignored; however, cells with the value zero are included.
Arguments that are error values or text that cannot be translated into numbers cause errors.
The MODE.SNGL function measures central tendency, which is the location of the center of a group of numbers in a statistical distribution.
Thanks for reading CFI’s guide to important Excel functions! By taking the time to learn and master these functions, you’ll significantly speed up your financial analysis. To learn more, check out these additional CFI resources:
To master the art of Excel, check out CFI’s Excel Crash Course, which teaches you how to become an Excel power user. Learn the most important formulas, functions, and shortcuts to become confident in your financial analysis.
Take your learning and productivity to the next level with our Premium Templates.
Upgrading to a paid membership gives you access to our extensive collection of plug-and-play Templates designed to power your performance—as well as CFI's full course catalog and accredited Certification Programs.
Gain unlimited access to more than 250 productivity Templates, CFI's full course catalog and accredited Certification Programs, hundreds of resources, expert reviews and support, the chance to work with real-world finance and research tools, and more.