NORM.DIST Function
Calculates the probability that variable x falls below or at a specified value
What is the NORM.DIST Function?
The NORM.DIST Function[1] is categorized under Excel Statistical functions. It will calculate the probability that variable x falls below or at a specified value. That is, it will calculate the normal probability density function or the cumulative normal distribution function for a given set of parameters.
To understand what normal distribution is, consider an example. Suppose we take an average of 30 minutes to complete a task, with a standard deviation of 5 minutes. Assuming a normal distribution for the time it takes to complete the work, we can calculate the percentage of time for which the time would be between 25 minutes and 35 minutes.
As a financial analyst, the NORM.DIST function is useful in stock market analysis. In investing, we need to balance between risk and return and aim for the best possible return. Normal distribution helps quantifies the two aspects, risk and return, by the mean for returns and the standard deviation for risk.
Formula
=NORM.DIST(x,mean,standard_dev,cumulative)
The NORM.DIST uses the following arguments:
- X (required argument) – This is the value for which we wish to calculate the distribution.
- Mean (required argument) – The arithmetic mean of the distribution.
- Standard_dev (required argument) – The standard deviation of the distribution.
- Cumulative (required argument) – This is a logical value. It specifies the type of distribution to be used: TRUE (Cumulative Normal Distribution Function) or FALSE (Normal Probability Density Function).
We can use 1 for TRUE and 0 for FALSE when entering the formula.
The formula used in calculating the normal distribution is:
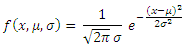
Where:
- μ is the mean of the distribution
- σ2 is the variance
- x is the independent variable for which you want to evaluate the function
How to use the NORM.DIST Function in Excel?
The NORM.DIST function was introduced in Excel 2010. To understand the uses of the function, let’s look at an example:
Example
Suppose we know a friend who claims that his IQ is above 130. We know that the population mean IQ is 100 and the population standard deviation for IQ is 15. Based on this data, we can calculate the probability that our friend has an IQ above 130.
The formula to use is:
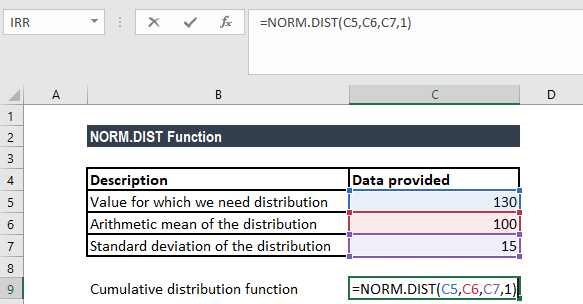
We get the result below:
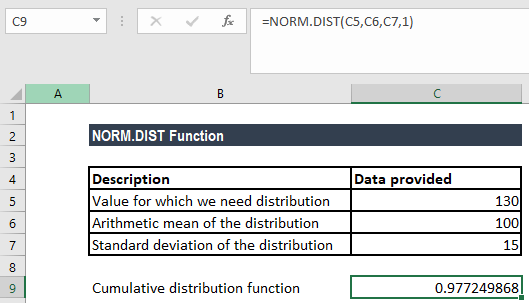
The function gave us a result of 0.977, which means that there is a 2% probability of our friend showing an IQ of 130.
If we wish to calculate the probability that our friend has an IQ equal to exactly 130, we should use the following formula:
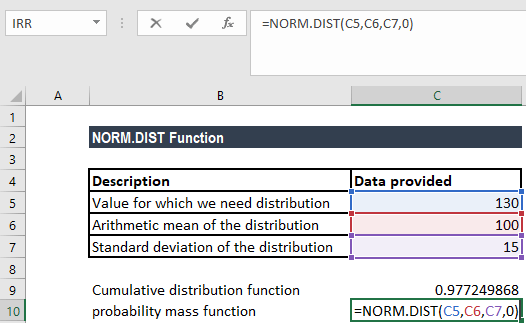
We get the result below:
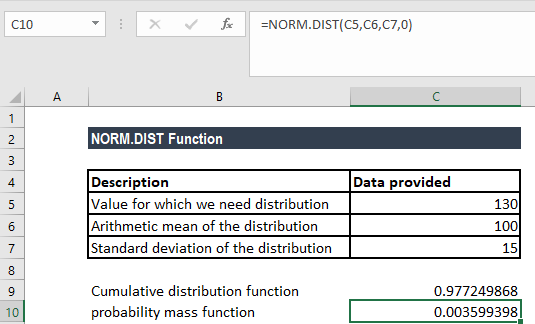
That indicates roughly 0.35% of the population shows an IQ of 130. Here, Excel estimated the probability by using a small range for the single value.
A few notes about the NORM.DIST Function
- NORM.DIST replaces the NORMDIST function.
- The NORM.DIST() function refers to any normal distribution, whereas the NORMSDIST() compatibility function and the NORM.S.DIST() consistency function refer specifically to the unit normal distribution.
- #NUM! error – Occurs if the given standard_dev argument is less than or equal to zero.
- #VALUE! error – Occurs when any of the given arguments is non-numeric or is a non-logical value.
Click here to download the sample Excel file
Additional Resources
Thanks for reading CFI’s guide to important Excel functions! By taking the time to learn and master these functions, you’ll significantly speed up your financial analysis and Excel modeling. To learn more, check out these additional CFI resources:
- Excel Functions for Finance
- Advanced Excel Formulas Course
- Advanced Excel Formulas You Must Know
- Excel Shortcuts for PC and Mac
- See all Excel resources
Article Sources
Excel Tutorial
To master the art of Excel, check out CFI’s Excel Crash Course, which teaches you how to become an Excel power user. Learn the most important formulas, functions, and shortcuts to become confident in your financial analysis.

Launch CFI’s Excel Crash Course now to take your career to the next level and move up the ladder!


