PROB Function
Calculates the probability that is associated with a given range
What is the PROB Function?
The PROB Function[1] is categorized under Excel Statistical functions. It will calculate the probability that is associated with a given range.
In financial analysis, the PROB function can be useful in estimating business losses. It can also be used by a risk manager to carry out financial probability analysis.
Formula
=PROB(x_range, prob_range, [lower_limit], [upper_limit])
The PROB function uses the following arguments:
- X_range (required argument) – This is the range of numeric values of x with which there are associated probabilities.
- Prob_range (required argument) – This is the set (array) of probabilities that is associated with values in x_range. The array must be of the same length as the x_range array and the values in prob_range must add up to 1.
- Lower_limit (optional argument) – This is the lower boundary of the value for which we want a probability.
- Upper_limit (optional argument) – This is upper boundary of the value for which you want a probability. When we omit this argument, the PROB function will simply return the probability associated with the value of the supplied lower_limit.
How to use the PROB Function in Excel?
To understand the uses of PROB function, let’s consider a few examples:
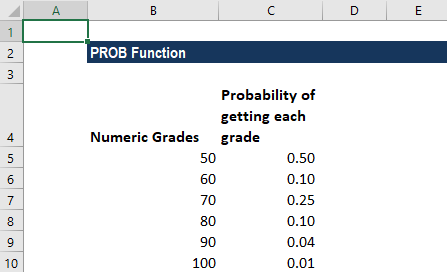
Example 1
Suppose we are given the data below:
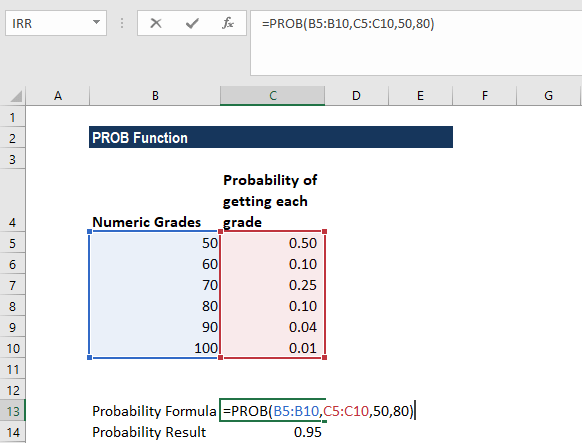
The probability for the given range when the lower limit is set to 50 and the upper limit is 80 would be:
Example 2
Let’s assume we are given two dice and we wish to find the probability of getting a roll of 10 or higher.
The possible outcomes when we roll two dice are:
When we roll dice 1 and dice 2, the chance of getting 2 is possible only when we get 1 on both dice, so chance = 1.
To get all chances, we can make an array that looks like the one below:
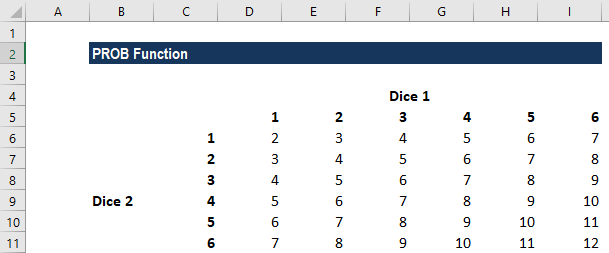
We listed the numbers 1 to 6 and then in cell D6, we added the value of C6 and D5. Similarly, for D7 it is the sum of C7 and D6.
Now for calculating chances, we can use the formula below:
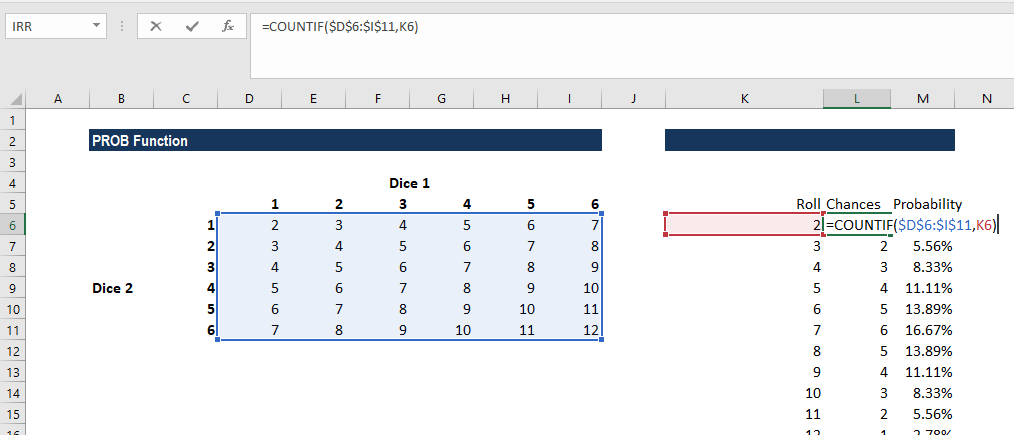
The COUNTIF function is used wherein the array is given as the range and the criteria argument is the roll.
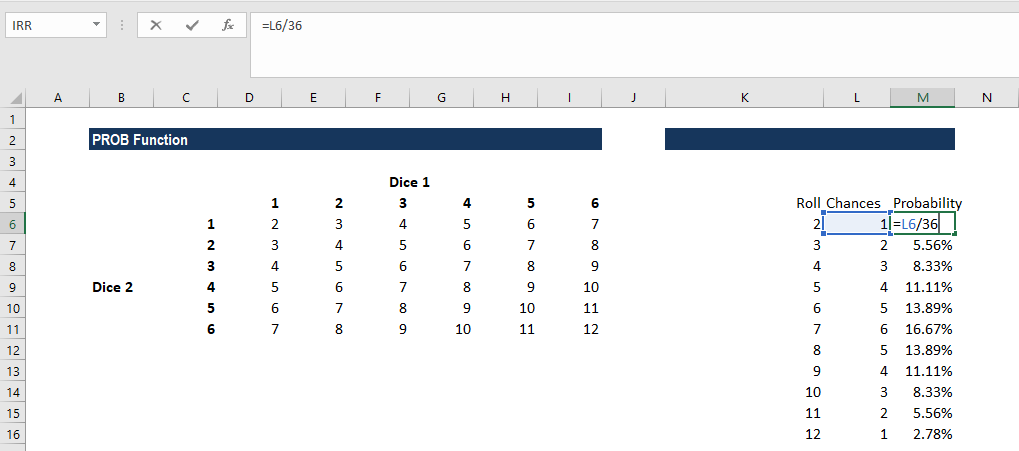
For probability, we divided the chances by 36, as there are 6 x 6 = 36 possible rolls.
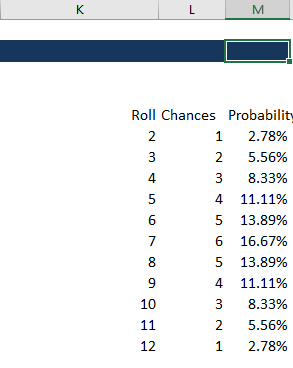
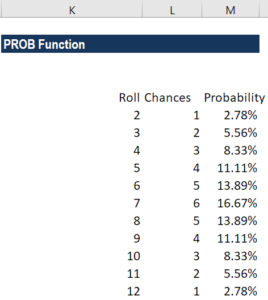
The table will look like this:
Now let’s calculate the probability of getting a roll higher than 10 using the PROB function. The formula to use is:
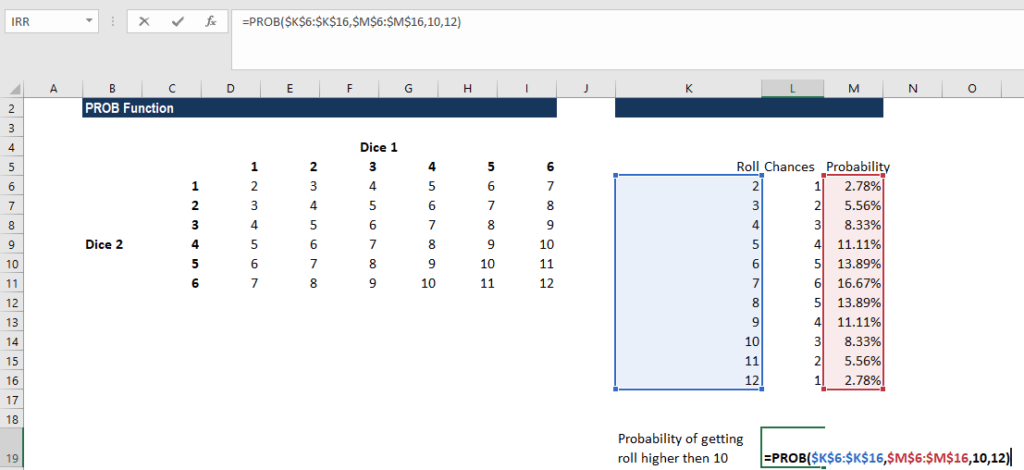
We get the result below:
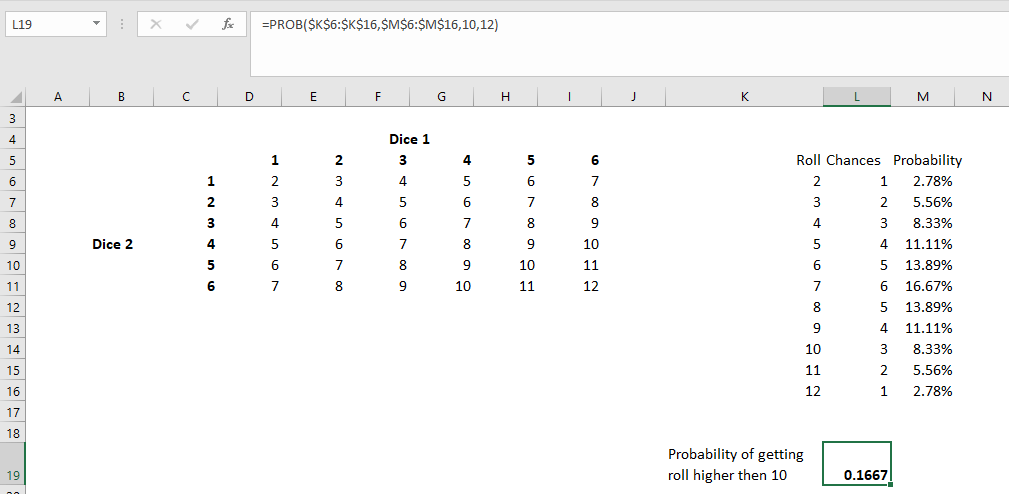
We can cross-check the figures by adding the individual probability calculated: (8.33%+5.56%+2.78%) = 16.67%.
Few things to remember about the PROB Function
- #NUM! error – Occurs if either:
- Any value in the given prob_range is less than 0 or greater than 1; or
- The values in the given prob_range do not add up to 1.
- N/A! error – Occurs if the given x_range and prob_range arrays are of different lengths (i.e., contain different numbers of data points).
- If we omit the upper_limit, PROB returns the probability of being equal to the lower_limit.
- The PROB function was introduced in MS Excel 2007 and hence is unavailable in earlier versions.
Click here to download the sample Excel file
Additional Resources
Thanks for reading CFI’s guide to important Excel functions! By taking the time to learn and master these functions, you’ll significantly speed up your financial analysis. To learn more, check out these additional CFI resources:
- Excel Functions for Finance
- Advanced Excel Formulas Course
- Advanced Excel Formulas You Must Know
- Excel Shortcuts for PC and Mac
- See all Excel resources
Article Sources
Excel Tutorial
To master the art of Excel, check out CFI’s Excel Crash Course, which teaches you how to become an Excel power user. Learn the most important formulas, functions, and shortcuts to become confident in your financial analysis.

Launch CFI’s Excel Crash Course now to take your career to the next level and move up the ladder!


