SLOPE Function
Return the slope of the linear regression line through the data points in known_y’s and
What is the SLOPE Function?
The SLOPE Function[1] is categorized under Excel Statistical functions. It will return the slope of the linear regression line through the data points in known_y’s and known_x’s. In financial analysis, the SLOPE function can be used to calculate the beta of a stock.
Slope / Beta Formula
=SLOPE(known_y’s, known_x’s)
The SLOPE function uses the following arguments:
- Known_y’s (required argument) – This is an array or range of numeric dependent data points.
- Known_x’s (required argument) – This is the set of independent data points.
Notes
- The length of the known_x’s array should be the same length as the known_y’s, and the variance of the known_x’s must not be zero.
- The function uses the following equation to calculate the slope of the linear regression line through a set of given points:
Where:
X and Y are the sample means (the averages) of the known x’s and the known y’s.
- If an array or reference argument contains text, logical values, or empty cells, the values are ignored. However, cells with the value zero are included.
- The arguments must be either numbers or names, arrays, or references that contain numbers.
- The algorithm used in the SLOPE and LINEST functions are different. The difference between these algorithms can lead to different results when data is undetermined and collinear. For example, if the data points of the known_y’s argument are 0 and the data points of the known_x’s argument are 1, then:
- SLOPE will return a #DIV/0! error.
- LINEST will return a value of 0. The LINEST algorithm is designed to return reasonable results for collinear data, and in this case, at least one answer can be found.
How to use the SLOPE Function in Excel?
To understand the uses of the SLOPE function, let’s consider an example:
Example
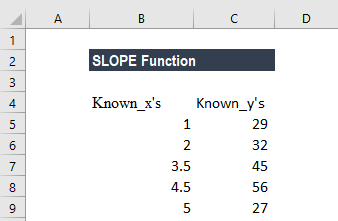
Suppose we are given the following data about the known_x’s and known_y’s:
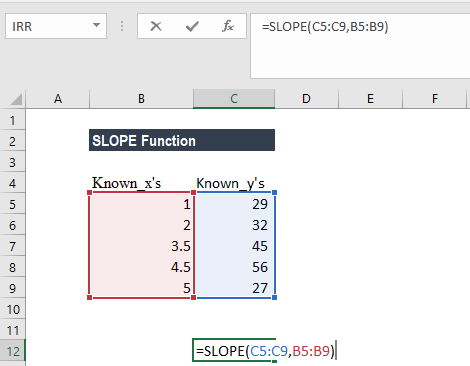
To calculate the slope of the linear regression line through the known_x’s and known_y’s, we will use the formula below:
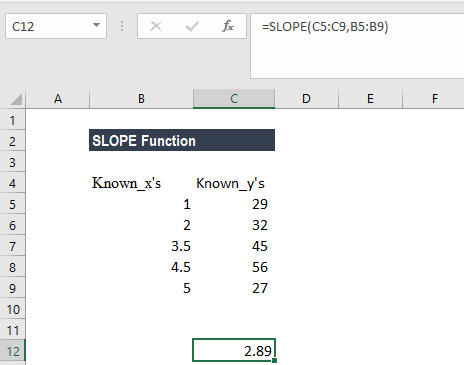
We get the result below:
Things to remember about the SLOPE Function
- #N/A! error – Occurs when the given known_x’s and known_y’s are of different lengths.
- #DIV/0! error – Occurs when:
- The variance of the given known_x’s evaluates to zero; or
- Any of the given known_x’s or known_y’s arrays are empty.
Click here to download the sample Excel file
Additional Resources
Thanks for reading CFI’s guide to the Excel SLOPE function. By taking the time to learn and master these functions, you’ll significantly speed up your financial analysis. To learn more, check out these additional CFI resources:
- Excel Functions for Finance
- Advanced Excel Formulas Course
- Advanced Excel Formulas You Must Know
- List of Finance Certifications
- See all Excel resources
Article Sources
Excel Tutorial
To master the art of Excel, check out CFI’s Excel Crash Course, which teaches you how to become an Excel power user. Learn the most important formulas, functions, and shortcuts to become confident in your financial analysis.

Launch CFI’s Excel Crash Course now to take your career to the next level and move up the ladder!


