STDEV.P Function
Calculates the standard deviation based on an entire population given as arguments
What is the STDEV.P Function?
The STDEV.P Function[1] is categorized under Excel Statistical functions. STDEV.P will calculate the standard deviation that is based on an entire population given as arguments. It will ignore logical values and text.
As a financial analyst, the STDEV.P function can be useful in, for example, calculating deviations in revenue. Portfolio managers often use standard deviation to measure and keep track of their portfolios’ risks.
The STDEV.P function was introduced in MS Excel 2010 and, hence, is not available in earlier versions. However, the function is simply an updated version of the older STDEVP function.
Formula
=STDEV.P(number1,[number2],…)
The STDEV.P function uses the following arguments:
- Number1 (required argument) – This is the first number argument that corresponds to a population.
- Number2 (required argument) – This is another number argument that corresponds to the population.
Notes
- The given arguments must provide at least two numeric values to the function.
- The arguments should be between 1 and 255 numeric values, arrays of values, or references to cells containing numbers.
- Arguments can either be numbers or names, arrays, or references that contain numbers.
- The function is used when we want to calculate the standard deviation for a whole population. If we are calculating the standard deviation of a sample of a population, we need to use the STDEV.S function.
How to use the STDEV.P Function in Excel?
As a worksheet function, STDEV.P can be entered as part of a formula in a cell of a worksheet. To understand the uses of the function, let us consider an example:
Example 1
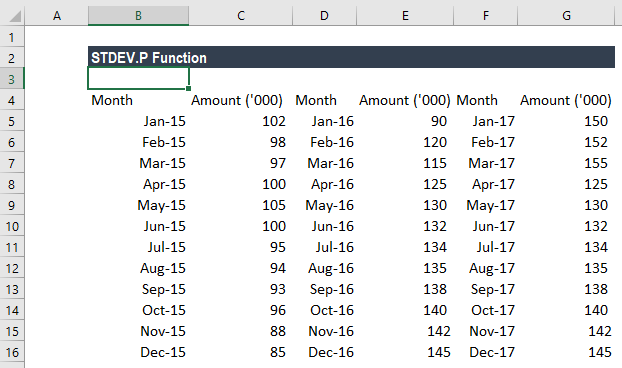
Suppose we are given a record of a business’ monthly sales figures over the last three years, as shown below:
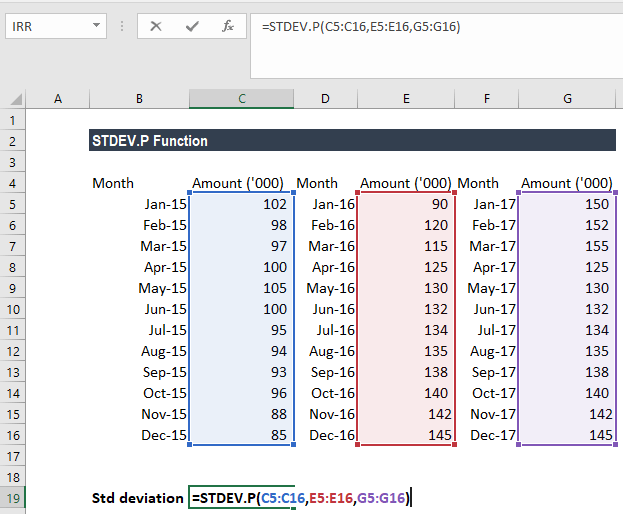
For the standard deviation, the formula used is:
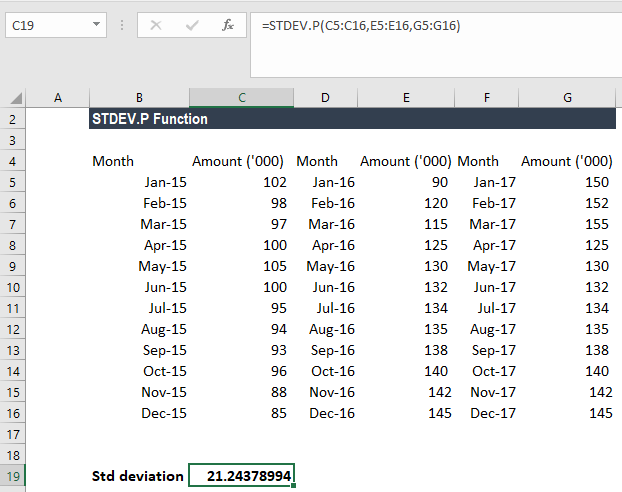
We get the results below:
The equation used for this is:
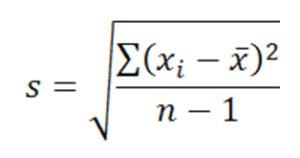
Where:
- x takes on each value in the set;
- x is the average (statistical mean) of the set of values;
- n is the number of values.
Things to remember about the STDEV.P Function
- #DIV/0! error-– Occurs if none of the values that are supplied to the function are numeric. Text representations of numbers that are provided as a part of an array are not recognized as numeric values by the STDEV.P function.
- #VALUE! error – Occurs if any of the given values provided directly to the STDEV function are text values that cannot be interpreted as numeric values.
- The STDEV.P function is used in calculating the standard deviation for an entire population. If we wish to calculate the standard deviation of a sample population, we need to use the STDEV.S function.
Click here to download the sample Excel file
Additional Resources
Thanks for reading CFI’s guide to important Excel functions! By taking the time to learn and master these functions, you’ll significantly speed up your financial modeling and valuation analysis. To learn more, check out these additional CFI resources:
- Advanced Excel Class
- Advanced Excel Functions
- Excel Shortcuts Cheatsheet
- STDEVPA Function
- See all Excel resources
Article Sources
Excel Tutorial
To master the art of Excel, check out CFI’s Excel Crash Course, which teaches you how to become an Excel power user. Learn the most important formulas, functions, and shortcuts to become confident in your financial analysis.

Launch CFI’s Excel Crash Course now to take your career to the next level and move up the ladder!


